


When Blue-Chip Dividend Yield Tells You to Buy
Forget analyst ratings and earnings forecasts. A blue-chip's dividend yield, plotted against its own 20-year range, tells you when it's cheap. One number, no models, no spin.
Cite this article
Freedom Isn't Free (2026) When Blue-Chip Dividend Yield Tells You to Buy. Available at: https://freedomisntfree.co.uk/articles/book-review-dividends-still-dont-lie-by-kelley-wright (Accessed: 5 July 2026).
Italicise the article title in your bibliography. Accessed date set to today.
TLDR
- Dividend yield is a stock's annual dividend payment divided by its share price, expressed as a percentage.
- Use historical yield ranges to identify when a stock is undervalued or overvalued based on its dividend yield.
- Focus on companies with long, unbroken dividend track records and strong balance sheets when applying the dividend yield strategy.
- UK investors can benefit from tax advantages when using dividend yield strategies within tax-efficient wrappers like ISAs and SIPPs.
Wright's dividend yield signal: buy or hold
| Current yield | Position in range | Signal |
|---|---|---|
| Near 20-year high | Top of band | Undervalued, buy |
| Mid-range | Middle of band | Hold, no edge |
| Near 20-year low | Bottom of band | Overvalued, avoid |
Only apply to blue chips with 25+ years of uninterrupted dividends and strong balance sheets.
Dividends Still Don't Lie: Book Review
Kelley Wright's "Dividends Still Don't Lie" presents a simple but powerful idea: dividend yield tells you more about a stock's value than earnings forecasts, analyst ratings, or market sentiment. When a blue-chip company's yield is high relative to its own history, the stock is cheap. When the yield is low, it is expensive. Buy in the first situation, avoid the second, and you remove most of the emotion from investing.
The book builds on the work of Geraldine Weiss, who pioneered dividend yield theory in the 1960s. Wright updates her framework with modern examples and makes the case that the approach still works decades later.
How the Dividend Yield Strategy Works
What Is Dividend Yield?
Dividend yield is a stock's annual dividend payment divided by its share price, expressed as a percentage. If a company pays £2 per share in annual dividends and the share price is £50, the dividend yield is 4%.
The yield moves inversely to the share price. When the price falls, the yield rises (assuming the dividend stays the same). When the price rises, the yield falls. This relationship is what makes yield useful as a valuation tool.
Using Historical Yield Ranges to Spot Value
Wright's core method involves charting a stock's dividend yield over many years to establish a historical yield range. A high-quality blue-chip stock will tend to oscillate between a high-yield zone (where the stock is undervalued) and a low-yield zone (where it is overvalued).
For example, imagine a FTSE 100 company that has traded with a yield between 3% and 6% over the past 20 years. If the yield is currently 5.5%, the stock is near the top of its historical range - a sign it is undervalued and worth buying. If the yield is 3.2%, the stock is near the bottom - a signal to hold off or consider selling.
The useful thing about Wright's method is that the yield band converts directly into prices. Because yield = dividend / price, you can rearrange it: price = dividend / yield. Take that same company and say it pays £1.80 per share in annual dividends:
| Yield band | Maths | Implied share price |
|---|---|---|
| 6% (undervalued zone) | £1.80 / 0.06 | £30.00 - buy below here |
| 4.5% (mid-range) | £1.80 / 0.045 | £40.00 - no edge |
| 3% (overvalued zone) | £1.80 / 0.03 | £60.00 - sell above here |
So a 20-year yield history plus this year's dividend gives you two hard numbers before the market opens: below £30 you are a buyer, above £60 you are a seller, and everywhere in between you do nothing. If the dividend rises to £2.00 next year, the whole band shifts up with it (buy below £33.33, sell above £66.67). No forecasting, no discounted cash flow model - one division.
This is not a guarantee. A high yield can also signal that the market expects a dividend cut, and a cut invalidates both numbers at once. Wright addresses this by insisting you only apply the strategy to companies with long, unbroken dividend track records and strong balance sheets. If the dividend is secure, a high yield is a buying signal, not a warning.
Which Stocks Qualify?
Wright is selective about which companies deserve this analysis. His criteria include:
- At least 25 years of uninterrupted dividend payments
- A history of dividend increases
- Investment-grade credit rating
- Strong cash flow coverage of the dividend
In the UK, companies like Unilever, Diageo, and RELX have the kind of long dividend histories that fit Wright's framework. The point is that you are looking for businesses where the dividend is as close to guaranteed as any equity payment can be.
Applying the Strategy as a UK Investor
Dividend Yield Investing Inside ISAs and SIPPs
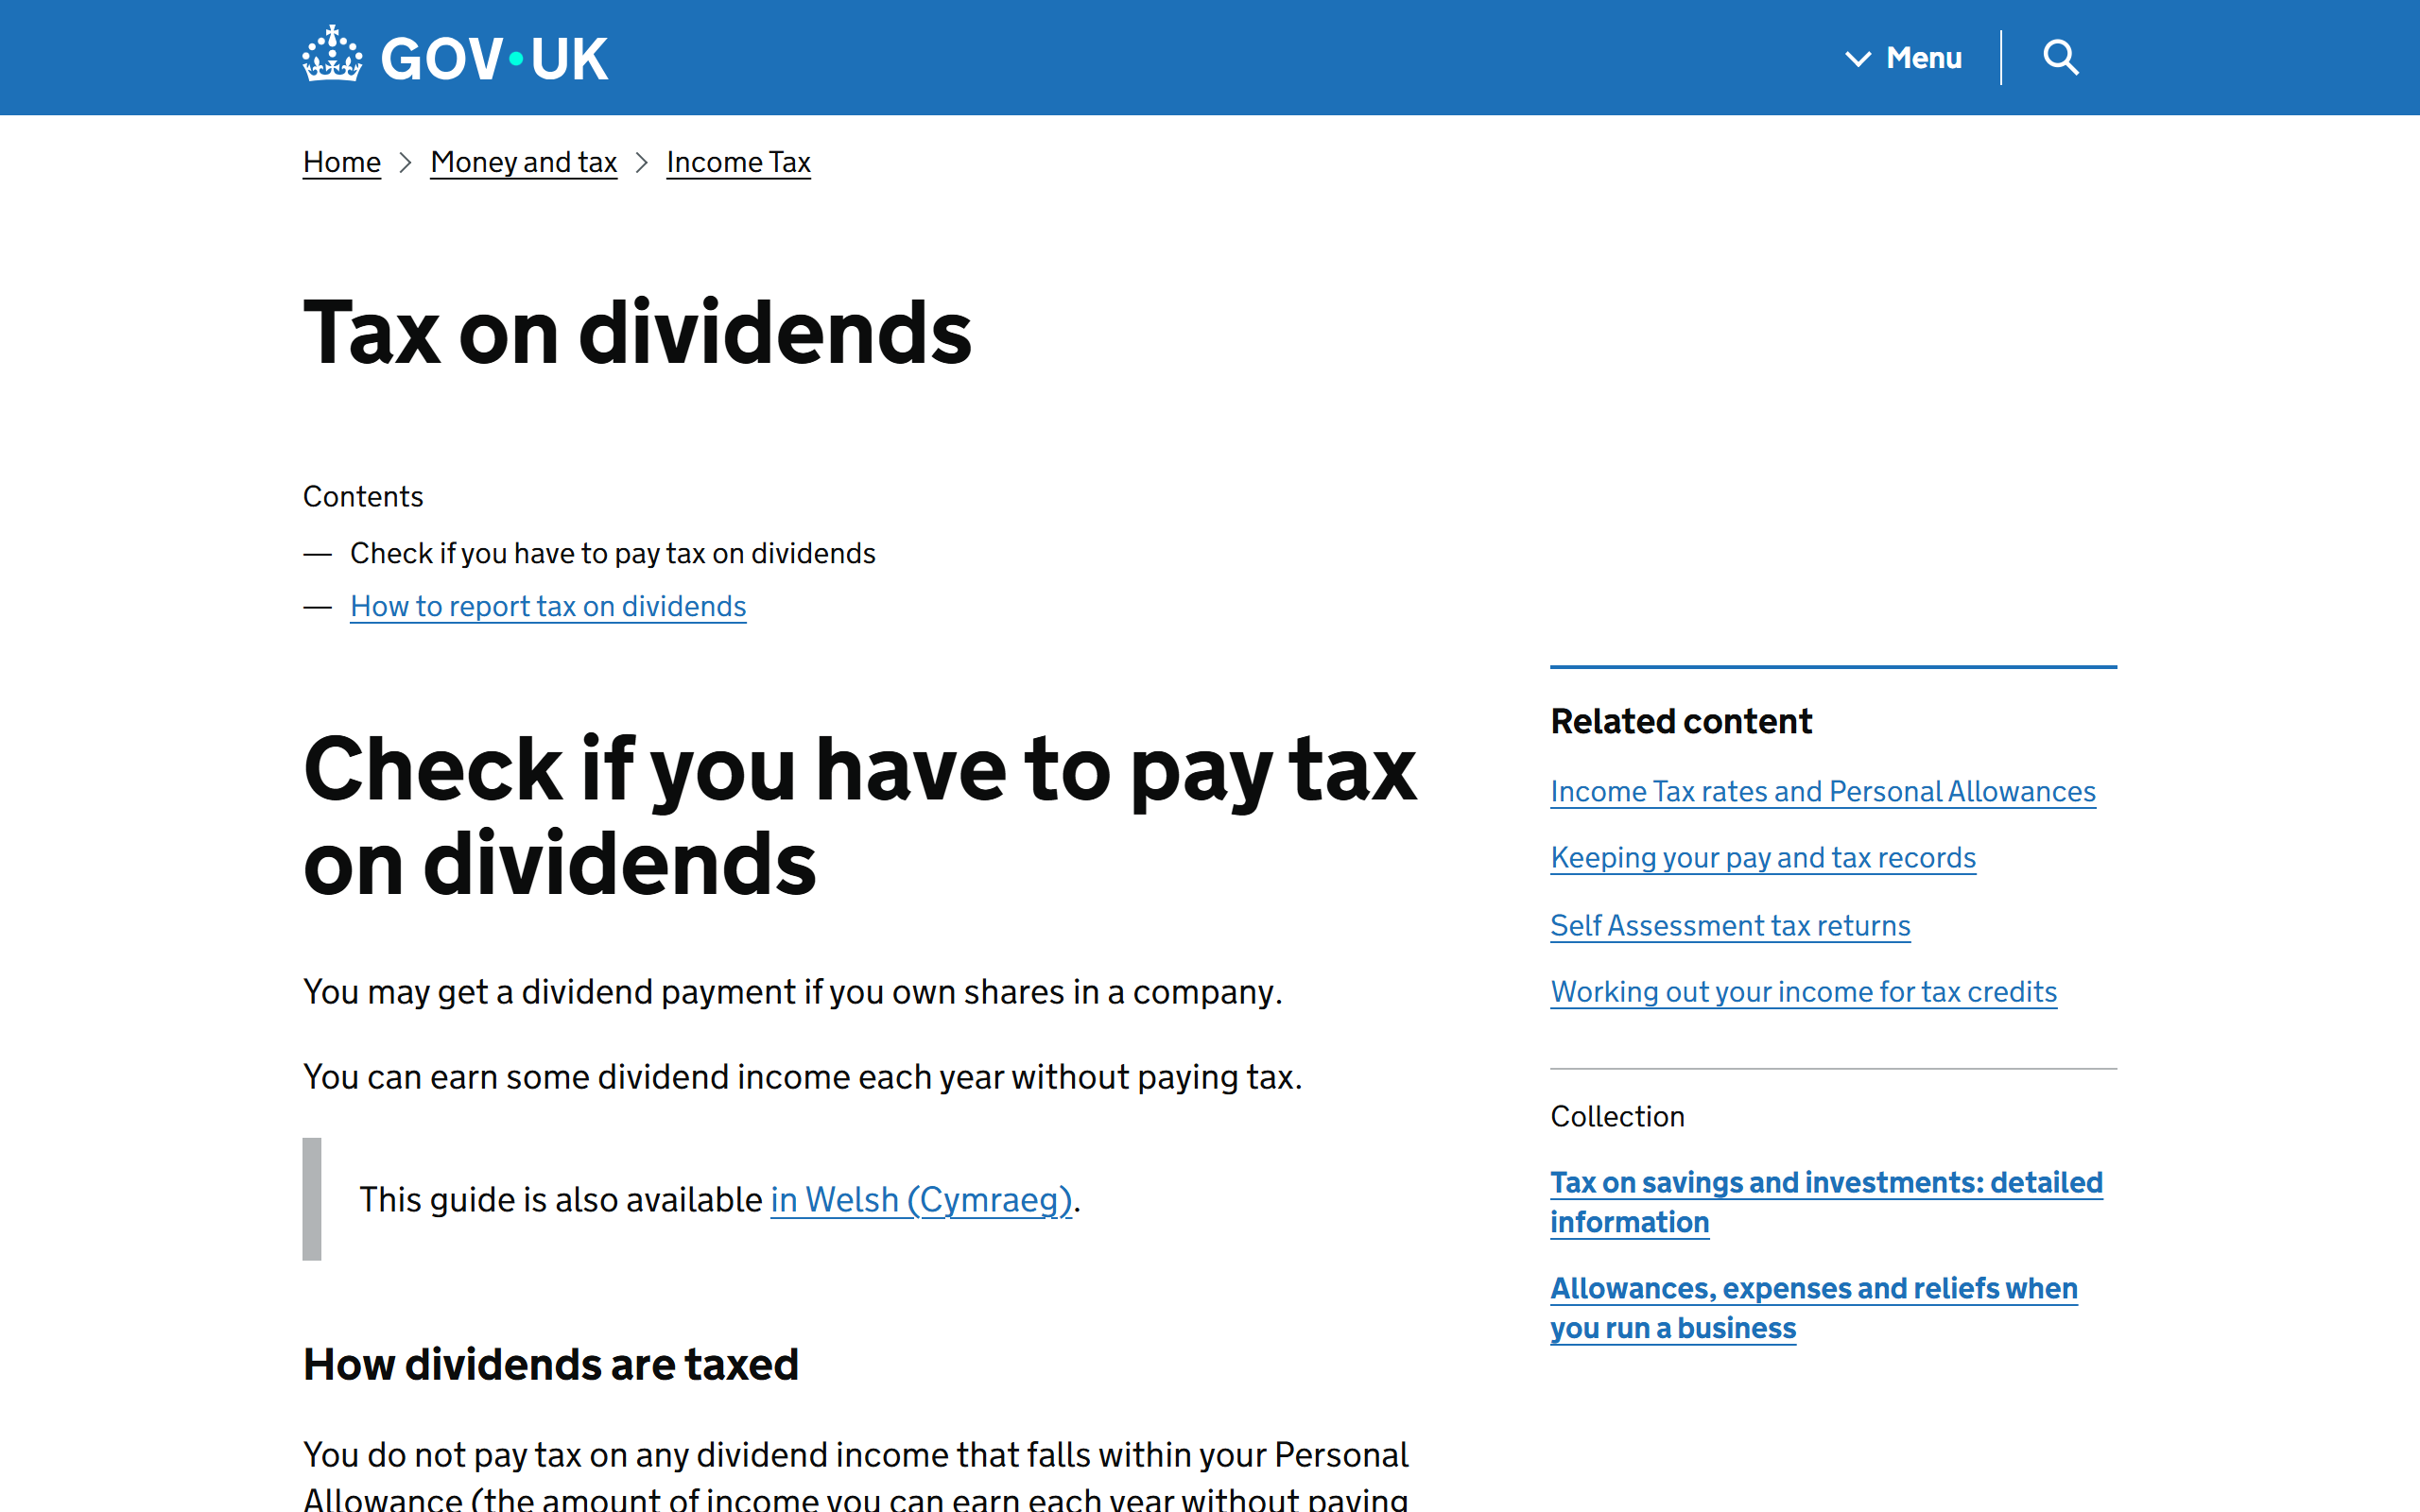
UK investors have a significant advantage when using Wright's strategy: tax-efficient wrappers. Inside a Stocks and Shares ISA, dividends are completely tax-free. Inside a SIPP, dividends compound without any immediate tax liability.
Outside these wrappers, UK investors receive a dividend allowance of £500 per year (2026/27), after which dividends are taxed at 10.75% (basic rate), 35.75% (higher rate), or 39.35% (additional rate). The November 2025 Budget added two percentage points to the basic and higher rates from April 2026, which makes the wrapper decision even less optional than it already was. For a dividend-focused strategy that generates meaningful income, holding shares inside an ISA is the obvious choice - our dividend tax guide works through the bands with examples.
For a broader look at what dividend investing involves and how it compares to growth and index strategies, see our introductory guide.
Adapting for UK Blue Chips
Wright's examples are mostly US stocks (Coca-Cola, Johnson & Johnson, Procter & Gamble). UK investors can apply the same method to FTSE dividend aristocrats, but should be aware of two differences:
- UK dividend culture is different. UK companies have historically paid a higher proportion of earnings as dividends compared to US companies, but they also cut dividends more readily during downturns. The wave of dividend cuts in 2020 (BP, Shell, BT, among others) showed that even blue-chip UK dividends are not sacrosanct.
- Sector concentration matters. The FTSE 100's highest yielders are concentrated in financials, oil, tobacco, and mining. A portfolio built purely on high-yield FTSE stocks can end up heavily exposed to a few cyclical sectors. Wright's method works best when applied across a diversified set of companies.
The question of whether yield on cost is a useful metric is worth understanding alongside Wright's approach, since it measures how your personal yield grows over time as dividends increase.
How Dividend Yield Removes Emotion From Investing
The Behavioural Advantage
The biggest practical benefit of Wright's system is that it replaces gut feelings with a mechanical decision rule. You do not need to predict where the market is heading or decide whether a sell-off is justified. You check the yield against the historical range, and the data tells you what to do.
This sidesteps several common cognitive biases that damage investment returns. Loss aversion, which makes investors hold losers too long, is less of a problem when you have an objective metric telling you whether the stock is cheap or expensive. Herd behaviour, which drives investors to pile into popular stocks, is countered by a system that explicitly tells you to avoid low-yield (overvalued) situations regardless of how popular the stock is.
The 2008 Financial Crisis as a Case Study
During the 2008-2009 crash, the FTSE 100 fell roughly 48% - from 6,731 in October 2007 to 3,512 at the March 2009 trough. Dividend yields on many blue chips spiked to levels not seen in decades. Wright's framework would have flagged this as a historic buying opportunity - and investors who bought high-yield blue chips in early 2009 captured both the dividend income and the subsequent price recovery.
Of course, the system requires nerve. Buying when markets are in freefall feels terrible, even when the data supports it. That is why having a written set of rules matters - it gives you something to follow when your instincts are screaming at you to sell.
Limitations of the Dividend Yield Approach
No strategy is without weaknesses, and Wright's approach has several:
It only works for dividend payers. Growth companies that reinvest all profits (like many tech stocks) cannot be analysed this way. A portfolio built purely on Wright's method will be tilted towards mature, income-producing businesses and will miss out on high-growth sectors.
Dividend cuts break the model. If a company slashes its dividend, the historical yield range becomes meaningless. Wright mitigates this by filtering for companies with long dividend track records, but no filter is perfect.
It ignores total return. A stock with a 2% yield that grows earnings at 15% per year will likely outperform a stock with a 6% yield that grows earnings at 2%. Wright's approach prioritises income over total return, which may not suit all investors. The debate over whether dividends are irrelevant to total return is worth reading alongside this review.
Frequently Asked Questions
What is the main idea of Dividends Still Don't Lie?
The book argues that dividend yield is the most reliable indicator of a blue-chip stock's value. By comparing a stock's current yield to its historical range, investors can identify when it is cheap (high yield) or expensive (low yield) without relying on earnings forecasts or market sentiment.
Does the dividend yield strategy work for UK stocks?
Yes, but with caveats. UK blue chips like Unilever, Diageo, and AstraZeneca have long enough dividend histories to apply the method. However, UK companies cut dividends more readily than their US counterparts, so investors need to verify that the dividend is well-covered by earnings and cash flow before treating a high yield as a buy signal.
How is dividend yield calculated?
Dividend yield is the annual dividend per share divided by the current share price, expressed as a percentage. For example, a stock paying £3 in annual dividends with a share price of £60 has a yield of 5%. The yield rises when the share price falls and falls when the share price rises.
Is dividend investing better than index investing?
They serve different purposes. Dividend investing, as Wright describes it, is an active stock-selection strategy that requires research and monitoring. Index investing is a passive approach that captures the entire market return at very low cost. Many investors combine both - using an index fund as a core holding and adding individual dividend stocks as satellite positions.
Should I hold dividend stocks inside an ISA?
For most UK investors, yes. Dividends received inside an ISA are completely tax-free, with no limit on the amount. Outside an ISA, you only receive a £500 annual dividend allowance before tax applies at 10.75% to 39.35% (2026/27 rates). If dividend income is a meaningful part of your strategy, sheltering it inside an ISA maximises your after-tax return.
Further Reading:
The Intelligent Investor - Benjamin Graham - Graham's classic covers the same territory as Wright from a broader value investing perspective, with an emphasis on margin of safety and disciplined analysis. (Affiliate link - we may earn a small commission at no extra cost to you.)
The Psychology of Money - Morgan Housel - Housel explains why even investors with the right strategy often fail because of emotional decision-making - the exact problem Wright's systematic approach aims to solve. (Affiliate link - we may earn a small commission at no extra cost to you.)
Read Next:
Sources
Enjoying the content?
If this site has been useful, a coffee goes a long way.
Browse more articles
Browse all