


Why Boomers Had It Easier in the UK: The Numbers
House price ratios were 3.5x earnings in the 1970s. They are 8-9x today. The honest comparison is harder for both camps in the row to accept than either of them lets on.
Cite this article
Freedom Isn't Free (2026) Why Boomers Had It Easier in the UK: The Numbers. Available at: https://freedomisntfree.co.uk/articles/why-boomers-had-it-easier (Accessed: 24 June 2026).
Italicise the article title in your bibliography. Accessed date set to today.
TLDR
- Yes, on most economic measures the post-war Baby Boomer generation in the UK had a structurally easier path to middle-class stability than younger generations face today.
- House price-to-earnings ratios were 3-4x in the 1970s-1990s. They are now 8-12x in much of the UK. Single biggest difference between then and now.
- Boomers also benefited from defined benefit pensions, free or grant-funded university, more secure employment, and decades of asset price inflation.
- Caveats matter: 1970s inflation was brutal, the 1980s industrial collapse devastated many regions, and not all boomers became wealthy. But the structural opportunity set was wider for that generation than the one being offered now.
Why Boomers Had It Easier in the UK: The Numbers
Yes, boomers in the UK had it structurally easier than younger generations on most economic measures. UK house price-to-earnings ratios were 3.5x in the 1970s and are 8-9x today. Defined benefit pensions were standard and have largely vanished from the private sector. University was free for most boomer graduates and now costs around £45,000-£60,000 in loan debt. Below is what the data actually shows, where the gap is real, where it is not, and what to do with that knowledge.
Talking honestly about generational economics is a fast way to get into a row. Younger people accuse boomers of pulling the ladder up; older people accuse younger people of laziness, entitlement, or spending too much on flat whites. The argument generates more heat than light because it usually skips past what the actual numbers show. The numbers, when you line them up properly, support a more uncomfortable middle position: the post-war Baby Boomer generation in the UK genuinely did have a structurally easier path to middle-class stability than the path being offered to younger generations today, and pretending otherwise requires ignoring most of the data.
Contents
- Who counts as a boomer
- Housing: the biggest single difference
- Pensions: the defined benefit golden age
- University: from free to £9,250
- Employment: from secure to gig
- Asset ownership as the dividing line
- Where boomers did NOT have it easier
- The honest summary
- What this means for what to do now
- Frequently Asked Questions
Who counts as a boomer
The standard demographic definition: people born between 1946 and 1964. In UK terms, that means people who turned 18 between roughly 1964 and 1982 and started their working lives in an economy that looked nothing like the current one.
The boomer years contained meaningful sub-generations. Early boomers (born 1946-1955) had the easiest run in many ways. Later boomers (born 1956-1964) hit secondary school during the IMF crisis and entered the labour market into the early-1980s recession. Those experiences are genuinely different. Generalising across all 19 years has to be done carefully.
Housing: the biggest single difference
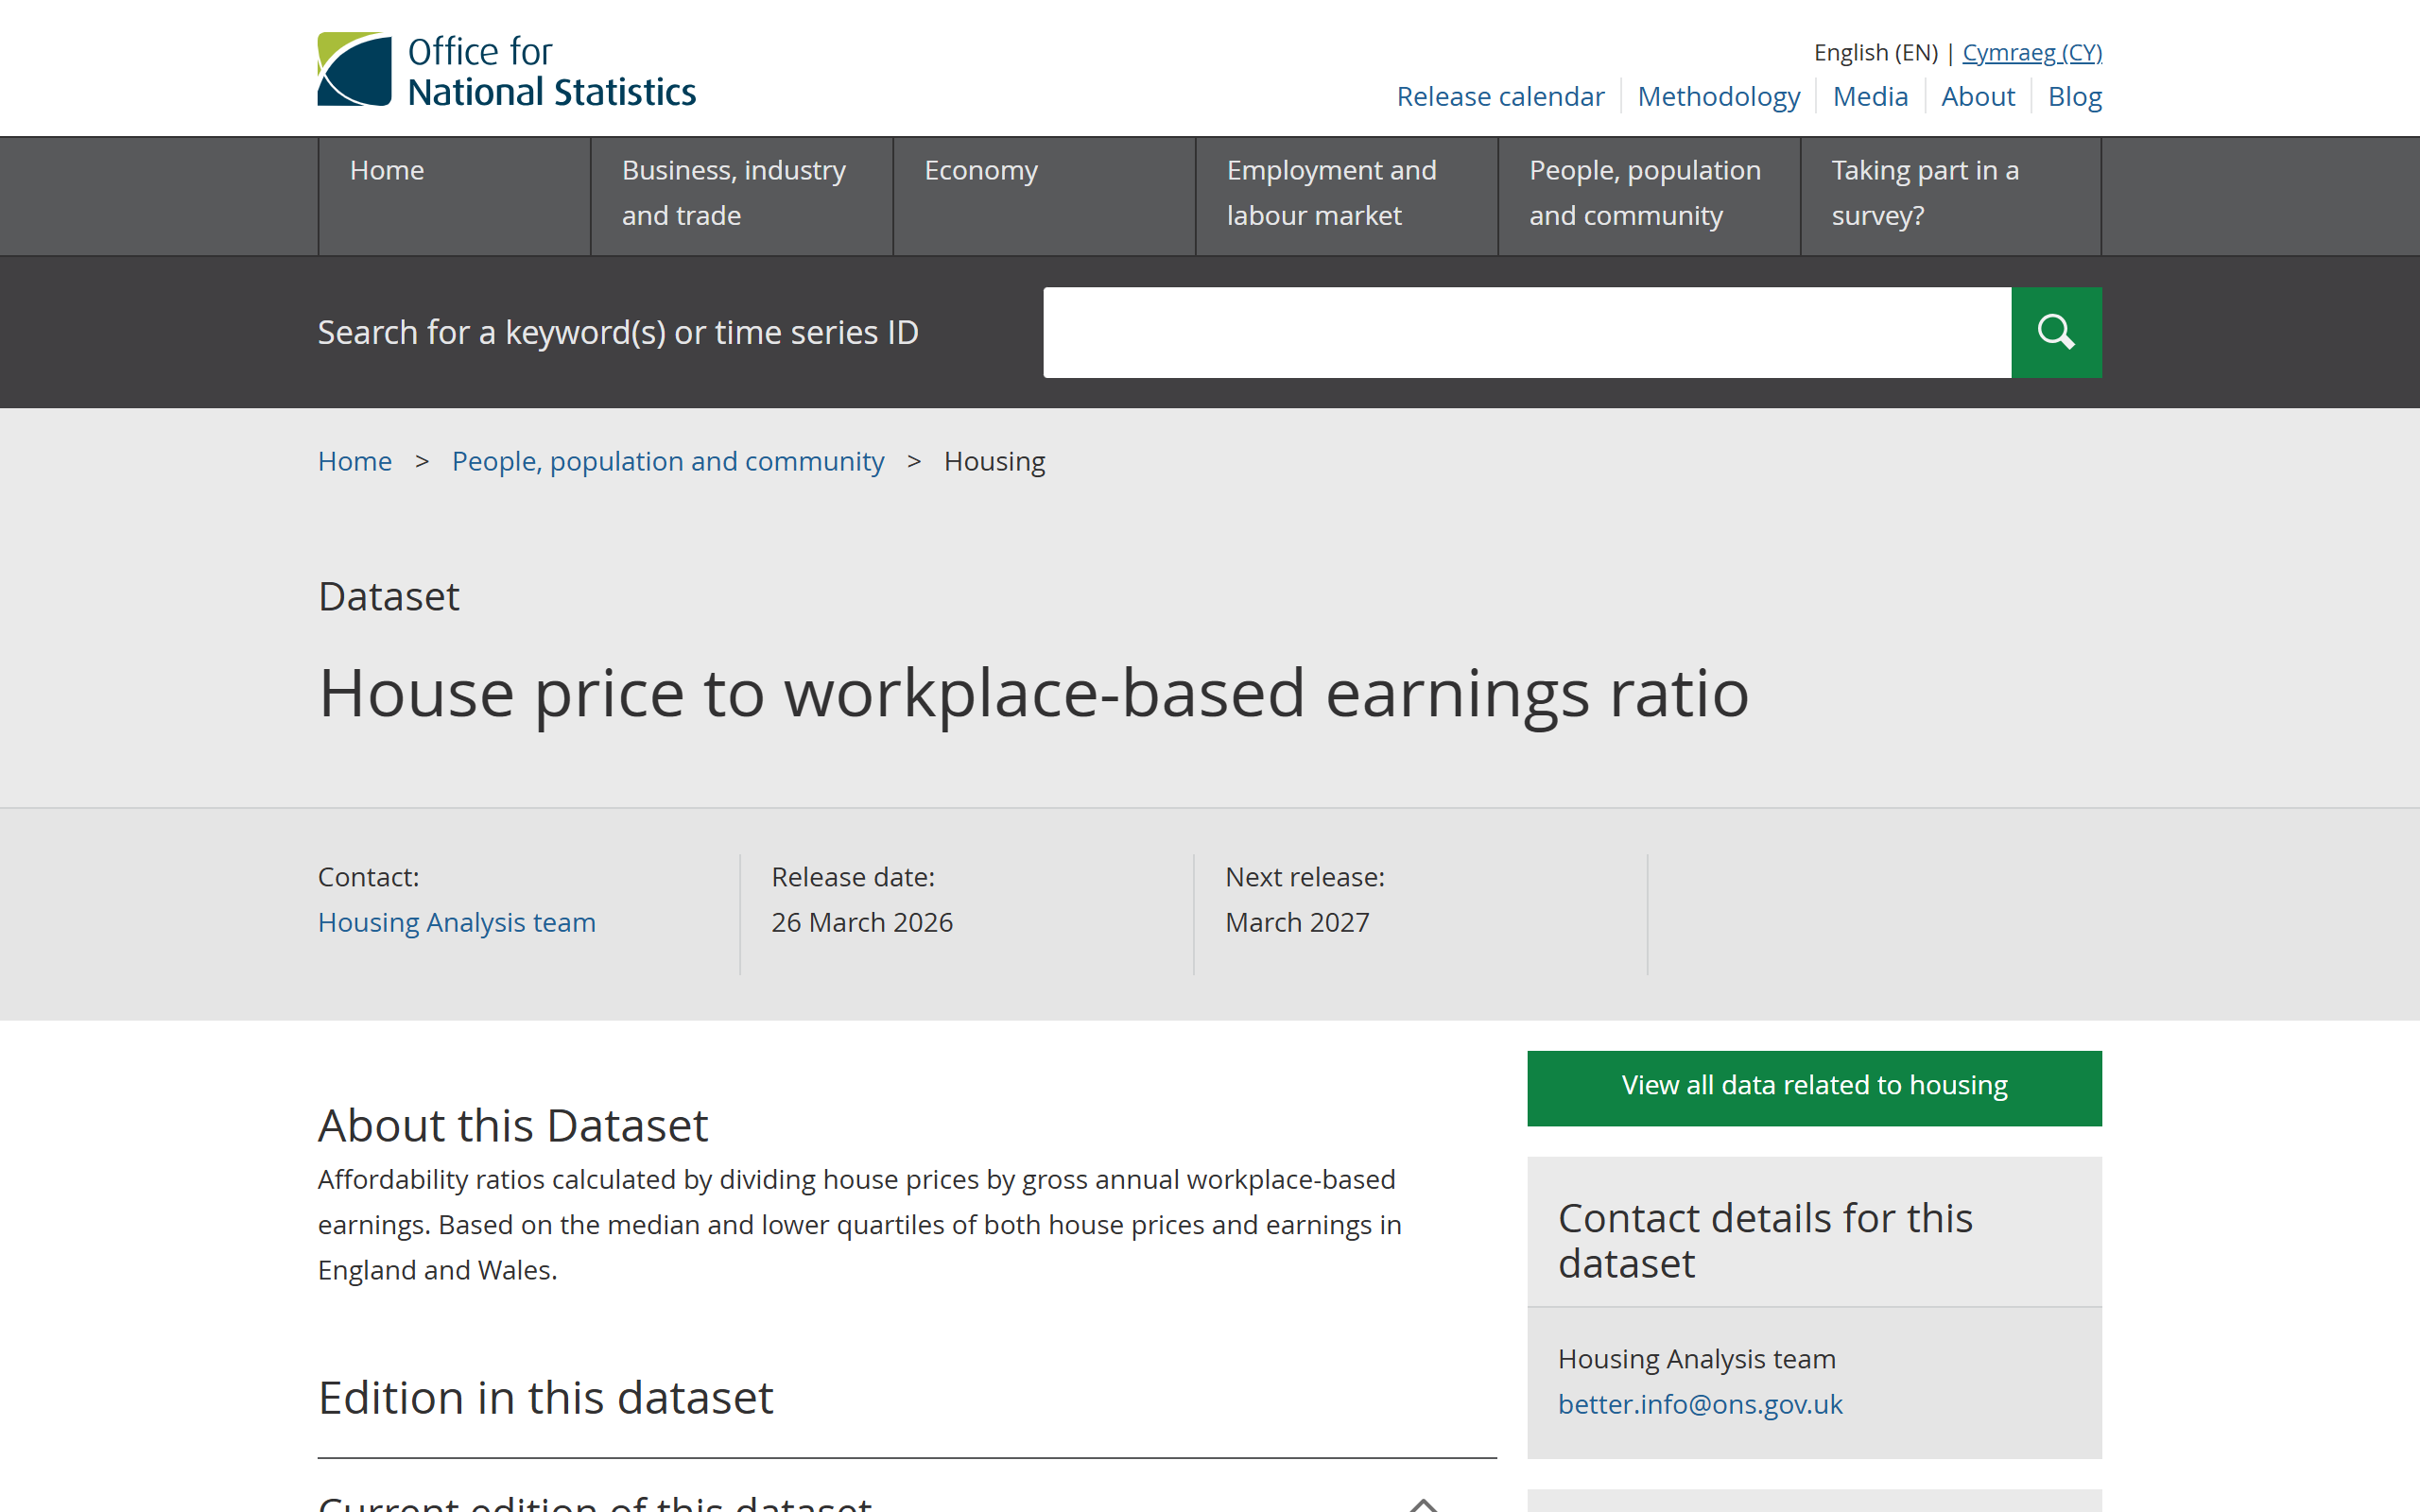
The single starkest comparison is the house price to earnings ratio, which measures the average house price as a multiple of average annual income. The figures below draw on ONS house price to workplace-based earnings ratio data and Halifax/Nationwide affordability series.
| Period | Approximate UK HPER |
|---|---|
| 1970s | 3.5x |
| 1980s | 4.0x |
| 1990s (early) | 3.5x |
| 2000 | 4.0x |
| 2010 | 6.5x |
| 2020 | 8.5x |
| 2024 | 8.0-9.0x (national average), 12-15x (London/SE) |
UK house price to earnings ratio, 1970-2024
Average house price as a multiple of average annual earnings
Source: ONS / Nationwide HPI
In 1980, a couple where both partners earned the average wage could buy an average UK house for roughly twice their combined annual income, with a 95% mortgage deposit of around 6 months of household income. In 2024 the same couple needs roughly four years of combined income to afford an average UK house, and the deposit alone is one to two years of one entire salary.
The follow-on effects are enormous:
- Family formation is delayed because people cannot afford a home large enough to start one.
- Savings are diverted into deposits rather than investments, foregoing decades of compound growth.
- Geographic mobility is restricted: moving for a better job often means losing a fixed-rate mortgage and re-entering the ladder at higher costs.
- Wealth accumulation through home equity (the main source of wealth for the median UK household) is delayed by 5-15 years.
A boomer who bought an average UK home in 1985 for around £30,000 has typically watched it grow to £250,000-£350,000 today, even ignoring any improvements. That is roughly an 8-12x nominal capital gain, almost entirely tax-free under private residence relief. No effort, no skill required. Just the timing of when they entered the market.
The picture is not uniform across the country. Our UK mortgage affordability map shows how the price-to-earnings ratio varies by region, which is the modern version of the same gap the boomers crossed in their twenties.
This is the headline. Almost everything else flows from this difference.
Pensions: the defined benefit golden age
Boomers entering the workforce in the 1960s and 1970s often had access to defined benefit (DB) pensions as standard: a fixed proportion of final salary (commonly 1/60th or 1/80th) per year of service, indexed to inflation, payable for life with a spouse's pension on death. A modern equivalent of a £25,000 a year inflation-linked annuity from age 65 would cost roughly £600,000-£800,000 to buy in the open market.
Defined contribution (DC) pensions, which now dominate the private sector, transfer all the investment risk to the employee and almost always produce a materially worse retirement income. Public sector workers (teachers, NHS, civil servants) still have DB-style schemes, though terms have been weakened since 2010. Private-sector workers under 40 in 2026 almost universally have only DC. State pension generosity has trended the same way: see why the triple lock is unsustainable for what younger generations should not assume about state support in retirement.
University: from free to £9,250
UK university funding has changed twice in ways that hit successive generations harder.
- Pre-1998: University tuition was free for UK students. Maintenance grants were means-tested and substantial. Many boomers and Gen Xers graduated with no student debt.
- 1998-2011: Tuition fees introduced at modest levels (£1,000 then rising). Grants partially replaced by loans. Manageable but not free.
- 2012 onwards: Tuition fees raised to £9,000+ per year. Maintenance loans only (no grants). Typical UK graduate now leaves with £45,000-£60,000 in student loan debt, repaid as a 9% surcharge on income above the threshold for up to 40 years.
The 9% income surcharge is, in practice, a 9% additional marginal tax rate on most graduate earnings. A boomer graduate in 1980 paid 0% of their salary towards student debt. A 2026 graduate pays 9% above the threshold for most of their working life. That is a permanent income gap that compounds across decades. When a UK degree is still worth the cost is its own question - we run the numbers in University vs Job UK: The Real Money Maths.
Employment: from secure to gig
The post-war labour market in the UK had several features that have largely vanished:
- Strong unions with collective bargaining covering large slices of the private sector.
- Manufacturing employment as a meaningful share of the economy, providing stable mid-skill jobs.
- Long-tenure employment as the norm, with internal promotion ladders and company-funded training.
- Defined benefit pensions as a standard part of the package.
- Single-earner household viability at average UK wages.
The modern labour market is substantially different:
- Union density in the UK private sector has fallen from over 50% in 1979 to under 13% in 2024.
- Manufacturing employment has dropped from around 25% of UK jobs in 1980 to around 8% today.
- Average tenure has shortened, mid-career restructuring is common, and many lower-end jobs are now agency, gig or platform work.
- DC pensions have replaced DB.
- Single-earner households on average UK wages cannot afford an average UK home in most regions.
These shifts are not boomers' fault individually. Most boomers did not choose to deindustrialise the UK or break the union movement. But the cumulative effect was that the labour market they entered was structurally more secure than the one their grandchildren are entering.
Asset ownership as the dividing line
The deeper economic story is that the past 45 years have been a golden age for owners of assets and a stagnant period for sellers of labour. Boomers happened to enter adulthood at exactly the right time to be on the ownership side of this divide.
Three trends compounded:
- Falling interest rates from the early 1980s onwards drove up the present value of every long-duration asset (stocks, bonds, houses).
- Globalisation boosted corporate profits by accessing cheaper labour and bigger markets, raising returns to capital.
- Asset-friendly policy (favourable tax treatment of capital gains, lower corporate tax, growth of tax-advantaged retirement accounts) directed resources toward asset accumulation.
People who entered the asset market in the 1970s and 1980s benefited from 40 years of these tailwinds with almost no skill required. People entering the asset market now face the opposite headwinds: rising interest rates, deglobalisation, and asset prices already inflated to reflect decades of past tailwinds.
This is the core of the intergenerational wealth gap, and it sits alongside the broader pattern explored in what late-stage capitalism actually means. It is not that younger generations work less hard. The structural conditions that built boomer wealth no longer exist for the younger generations following them.
Where boomers did NOT have it easier
It would be wrong to claim boomers had everything easier. Several genuinely harder features of their lives:
- 1970s inflation ran at over 20% per year at its worst, eroding savings and making financial planning enormously difficult.
- Mortgage rates hit 15-17% in the early 1990s, making the same nominal mortgage debt much harder to service.
- The 1980s industrial collapse devastated communities across the North, the Midlands, Scotland and Wales. Mass unemployment ran at over 3 million for much of the early 1980s.
- Healthcare was less advanced; survival rates for major conditions much lower.
- Technology that everyone now takes for granted (internet, mobile communications, computing power) did not exist for most of their working lives.
- Social attitudes were materially less free for women, LGBTQ+ people, and ethnic minorities. Many of the freedoms younger generations take for granted had to be fought for.
- Travel was prohibitively expensive for much of the boomer generation; international leisure travel was a luxury.
And critically: not all boomers became wealthy. Boomer renters, low-income workers, those in long-term unemployment, and those caught by deindustrialisation often did not benefit from the asset boom at all. Generational averages hide enormous variation. Owning a home and a good pension is a class story as much as a generational one.
The honest summary
For someone born in the UK in the 1940s or 1950s, the available life script was: leave school, get a job (often without university), buy a starter home in your early-to-mid 20s, raise a family on one or two modest incomes, build up a workplace pension, retire at 60-65 with a paid-off house and an inflation-linked income for life. Not guaranteed, but roughly achievable for the median person.
For someone born in the 1990s or 2000s, the script is: leave school, almost always go to university (and incur substantial debt), enter a labour market with weaker job security, postpone home ownership into your 30s or never achieve it, deal with DC pensions that may or may not produce a viable retirement, and face significantly higher housing and childcare burdens. Not impossible, but not the same script.
Working hard no longer reliably produces what it produced for the previous generation. That is a structural fact, not a personal failing. The UK wage stagnation tool shows what real wages have actually done against the cost of housing, energy and food since 1970, which is the clearest single picture of why the boomer-era script no longer fits the page.
What this means for what to do now
Knowing the game is tilted does not change what you should do as an individual:
- Start asset accumulation as early as possible. Compound interest cares about contributions and time, not generational fairness. Run your own numbers in the compound interest calculator or read investing small amounts monthly.
- Use every tax wrapper you can. ISAs, SIPPs, workplace pensions, Lifetime ISAs (with caveats).
- Be sceptical of advice that worked in 1985. Cash savings as a long-term wealth strategy, property as a guaranteed escalator, one-employer career planning. These were rational then and are increasingly not.
- Vote and participate in policy debates. Housing, planning, pension and tax policy all materially affect what is available to younger generations.
UK retail investors today have access to broad-market index funds at near-zero cost that did not exist for boomers at any point in their working lives. The tools are better. The structural conditions are harder. Both are true.
Frequently Asked Questions
Did boomers really have it easier than younger generations?
Yes, on housing affordability, university costs, pension provision and asset inflation. UK house price-to-earnings ratios have roughly doubled, DB pensions have largely vanished from the private sector, and university fees have gone from zero to £9,250 per year.
What years are UK boomers born in?
Anyone born between 1946 and 1964, so aged roughly 62 to 80 in 2026. Early boomers (1946-1955) had the easier economic ride; later boomers (1956-1964) entered the workforce during the early-1980s recession.
Why are boomers wealthier than younger generations?
They entered the housing market when it was cheap relative to incomes, had access to DB pensions far more generous than modern DC alternatives, and accumulated assets during decades of falling interest rates and rising valuations.
Did all boomers do well financially?
No. Boomer renters, low-paid workers, and people affected by 1980s deindustrialisation often did not benefit from the broader generational tailwinds. About a quarter of UK over-65s live in poverty after housing costs. The "boomer wealth" story is a class story as much as a generational one.
What can younger generations do about it?
Participate in asset markets as early and consistently as possible (index funds, pensions, ISAs), delay big consumption decisions until they make financial sense rather than copying boomer-era timelines, and engage politically on the policy issues (housing supply, planning, pensions) that shape what younger generations can build.
Read Next
- UK Productivity Stagnation: The Puzzle Since 2008 - the macro reason wages have not kept pace with asset prices, and why boomer-era pay scripts no longer work.
- Why the UK Won't Tax Wealth - the political economy that protects accumulated boomer wealth from redistribution.
- FIRE Is Harder in the UK Than the US - the practical arithmetic of building wealth from a lower base on a tighter income.
Further Reading:
The Psychology of Money - Morgan Housel - Housel's framing of how the era you happen to be born into shapes your financial outcomes more than skill or effort sits underneath the entire boomer-era debate. (Affiliate link - we may earn a small commission at no extra cost to you.)
Debt: The First 5,000 Years - David Graeber - A long view on how debt arrangements (student loans, mortgages, intergenerational transfers) shape who ends up owning what across a society. (Affiliate link - we may earn a small commission at no extra cost to you.)
Enjoying the content?
If this site has been useful, a coffee goes a long way.
Browse more articles
Browse all