


How to Read Company Financial Statements (UK)
If you can't tell a profitable business from a story stock in two minutes, you're guessing in a suit. Five ratios do the work, and most retail investors never bother to learn them.
Cite this article
Freedom Isn't Free (2026) How to Read Company Financial Statements (UK). Available at: https://freedomisntfree.co.uk/articles/how-to-read-financial-statements-uk (Accessed: 5 July 2026).
Italicise the article title in your bibliography. Accessed date set to today.
TLDR
- Learning how to read financial statements is the difference between buying a story and buying a business.
- The three core statements (income statement, balance sheet, cash flow) each tell you something the others hide.
- Five ratios do most of the work: ROE, debt-to-equity, operating margin, free cash flow yield, and interest cover.
- Buffett-style red flags include heavy debt loads, weak gross margins, capex-hungry industries, and no pricing power.
Five ratios that filter out bad businesses
| Ratio | Calculation | Good level |
|---|---|---|
| Return on Equity (ROE) | Net profit / shareholder equity | Above 15% consistently |
| Debt-to-equity | Total debt / equity | Below 0.5 (non-financials) |
| Operating margin | Operating profit / revenue | Widening over 5 years |
| Free cash flow yield | FCF / market cap | Above 5% |
| Interest cover | Operating profit / net interest | Above 4x |
Run any FTSE 100 candidate through these before deeper research.
How to Read Company Financial Statements (UK)
If you want to buy individual shares inside an ISA or SIPP, learning how to read financial statements is the single most useful skill you can pick up. Most people skim a glossy annual report, look at the share price chart, and call it research. The numbers tell a different story, and they are not hard once you know which rows actually matter. This guide walks UK investors through the three core statements every listed company publishes, the five ratios that do most of the heavy lifting, and the red flags that Warren Buffett and Benjamin Graham screen for before they put a penny in.
The aim is not to turn you into an equity analyst. It is to give you enough literacy to spot an obvious dog before you buy it, and enough vocabulary to argue with the next person who pitches you a "growth stock" on the back of a podcast.
Where to Find UK Company Financial Statements
Before you can read them, you need to find them. For UK-listed firms the routes are:
- Annual report PDFs on the company's investor relations page. This is the long form: full statutory accounts plus the strategic report. Always start here.
- Interim and half-year results posted as RNS announcements on the London Stock Exchange news service. These come out twice a year and are the freshest numbers.
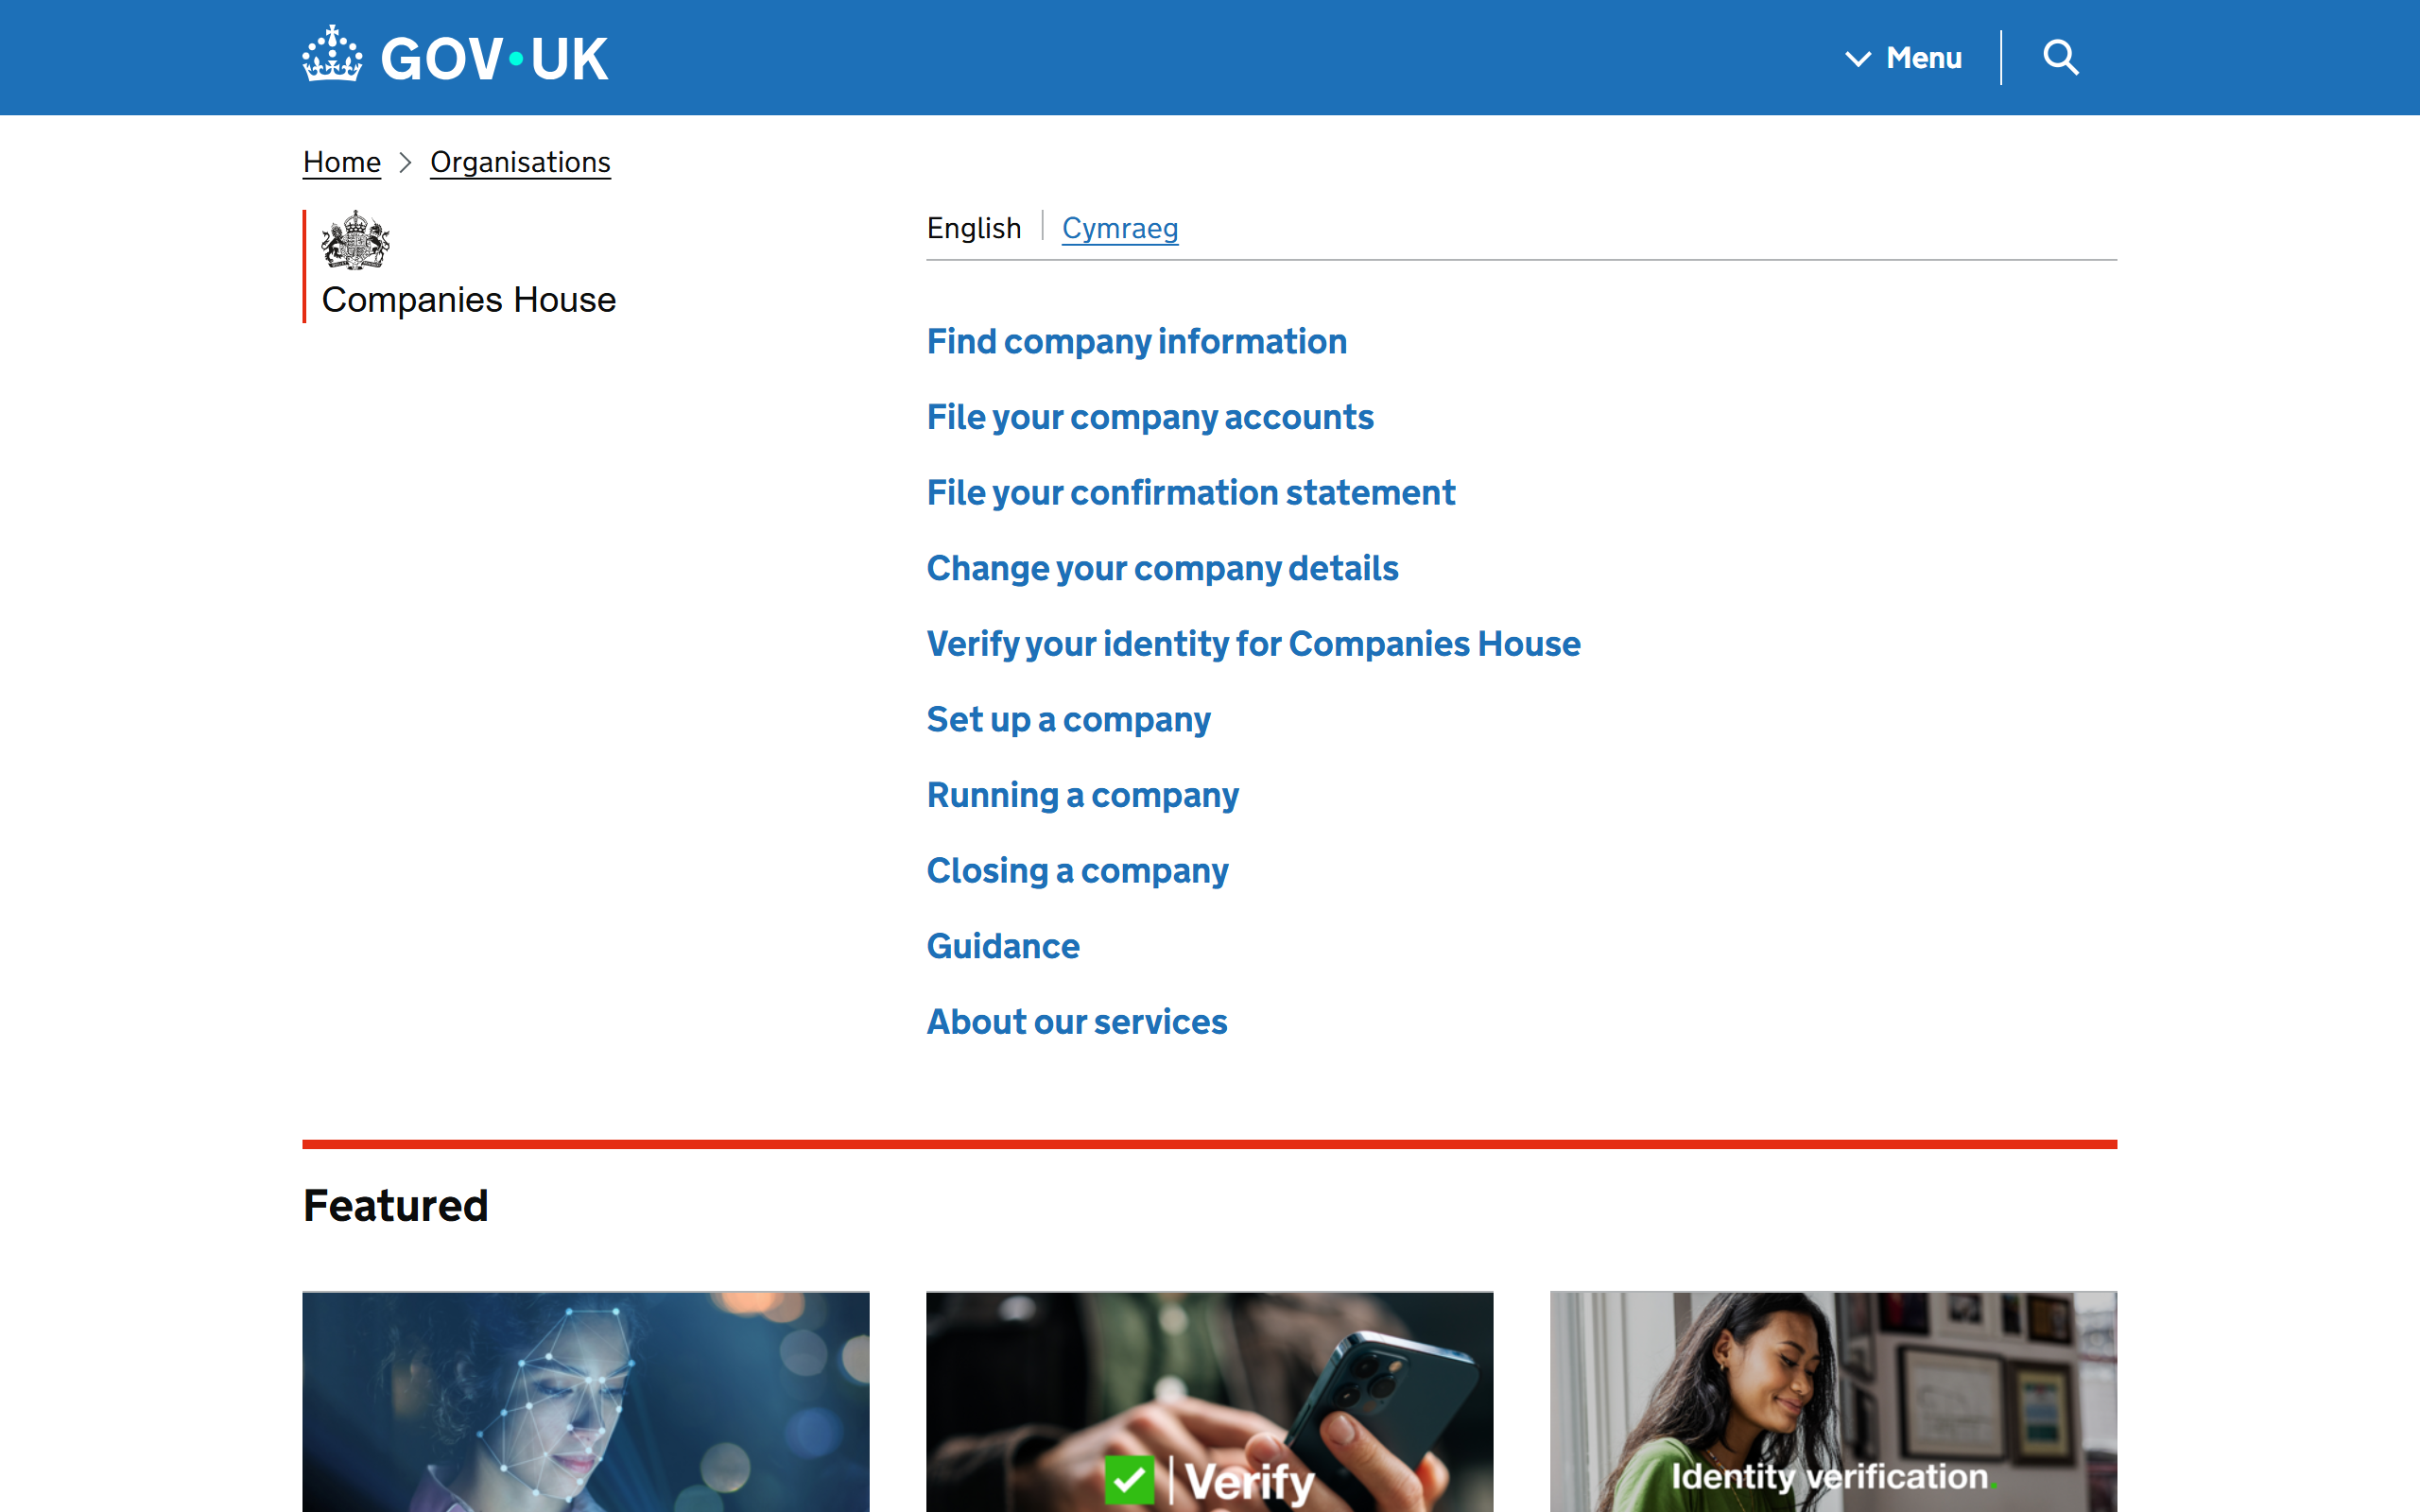
- Companies House for private UK firms or wholly-owned subsidiaries. Free, public, surprisingly useful. Filings are usually less detailed than listed-company accounts but include the three core statements.
- Broker research pages on platforms like Hargreaves Lansdown, AJ Bell, and Interactive Investor. Useful for ratio summaries, but always cross-check against the source filing.
UK companies report under IFRS rather than US GAAP. The layouts differ slightly from American 10-Ks, but the three statements and the underlying logic are the same.
The Income Statement: Are They Actually Making Money?
The income statement (also called the profit and loss statement, or P&L) covers a period of time, usually a year or a half-year. It starts with revenue at the top, subtracts costs as you go down, and ends with net profit at the bottom.
The four rows worth reading carefully:
- Revenue (the "top line"). Is it growing? More importantly, is it growing organically, or is it growing because the company keeps buying other companies? Acquisitive growth is fine, but it tends to be lower quality than organic growth from the same customer base.
- Gross profit. Revenue minus the direct cost of making the product. Divide gross profit by revenue and you get the gross margin. A consistently high and stable gross margin (above 40% for most decent businesses) is one of Buffett's favourite indicators of pricing power.
- Operating profit. Gross profit minus operating costs (sales, admin, R&D). Divide by revenue to get the operating margin. This tells you how efficient the business is at converting sales into profit before tax and financing costs. A widening operating margin over five years is a very good sign.
- Net profit. What is left after interest, tax, and any one-off items. Divide net profit by the number of shares outstanding and you get earnings per share (EPS). Be wary of EPS that grows only because of share buybacks rather than rising profit. The denominator can be juiced.
A common trap is focusing on the top and bottom lines while ignoring everything in between. A company can grow revenue 20% while collapsing margins, which usually means it is buying market share with discounts. That is not a durable business.
The Balance Sheet: What Do They Own and What Do They Owe?
The balance sheet is a snapshot at a single date: assets on one side, liabilities and equity on the other. The two sides must balance, hence the name.
Three things to check:
- Debt levels. Add short-term and long-term borrowings together, then divide by shareholders' equity. That is the debt-to-equity ratio. Below 0.5 is comfortable; above 1.0 starts to look heavy unless the business is in a sector where leverage is structurally normal (utilities, real estate, banks). Companies with too much debt go bust quickly when interest rates rise or revenues wobble.
- Interest cover. Operating profit divided by net interest expense. This lives partly on the income statement, but it is a balance sheet quality check. You want at least 4x. Below 2x and one bad quarter can wipe out their ability to service the loans.
- Quality of equity. Look at retained earnings as a percentage of total equity. A long history of retained earnings growth means management has been profitably reinvesting rather than diluting shareholders or borrowing to plug holes. A balance sheet stuffed with goodwill from overpriced acquisitions is the opposite signal.
UK accounting treats some items differently to US filings (operating leases now sit on-balance-sheet under IFRS 16, for example), so if you are comparing a UK firm with a US peer, check the notes before trusting a ratio.
The Cash Flow Statement: Is the Profit Real?
The cash flow statement is the one that scares accountants. Earnings can be massaged through accounting choices that are technically legal. Cash is much harder to fake. If you only learn to read one statement properly, make it this one.
It splits into three sections:
- Operating cash flow. Cash generated by the actual business. Compare this to net profit on the income statement. If operating cash flow is consistently below net profit, the company is booking revenue it has not collected, which is a warning sign.
- Investing cash flow. Mostly capital expenditure (capex) on property, plant, equipment, and acquisitions. Some capex is maintenance (replacing what wore out); some is growth (expanding the business). A railway, a chip foundry, or an oil major needs huge capex every year just to stand still. A software firm needs almost none. This is one of Buffett's filters.
- Financing cash flow. Dividends paid, shares bought back, debt raised or repaid.
The number that ties this all together is free cash flow: operating cash flow minus capex. Free cash flow is the cash a business can actually return to shareholders or use to grow. Divide free cash flow by market cap and you get the free cash flow yield, the cleanest valuation metric there is. A yield above 5% on a stable business is genuinely attractive. Below 2% and you are paying a premium for growth that may not arrive.
If you want to go deeper on plugging these numbers into a valuation, the companion piece on how to value a stock takes you through the next step.
The Five Ratios That Do Most of the Work
You do not need fifty ratios. Five will get you 80% of the way:
- Return on equity (ROE) = net profit / shareholders' equity. Above 15% consistently is the mark of a high-quality business. Above 20% for a decade is rare and worth paying attention to.
- Debt-to-equity = total debt / shareholders' equity. Below 0.5 for most non-financials.
- Operating margin = operating profit / revenue. Look at the five-year trend, not the single year.
- Free cash flow yield = free cash flow / market cap. The single best valuation check.
- Interest cover = operating profit / net interest. Above 4x is comfortable; below 2x is fragile.
Run any FTSE 100 or FTSE 250 candidate through these five before you go any further. Most of them will fail at least one, and that is fine - the point is to filter, not to find the perfect business. For a deeper look at what ratios tell you about price, see the explainer on intrinsic value.
Buffett's Red Flags (and Why UK Investors Should Care)
Buffett's filters are not gospel. He has structural advantages no retail investor has, including permanent capital, insurance float to invest, and the ability to demand seats on boards. But the screens he uses to reject companies before he even values them are useful to borrow:
- Heavy reliance on debt. A business that needs to keep refinancing to stay alive is one rate cycle away from a rights issue.
- No pricing power. If gross margin shrinks every time input costs rise, the company has no moat. Compare a supermarket (3-4% net margin, no pricing power) with a luxury goods firm (20%+ net margin, real pricing power).
- Low or volatile gross margins. Stable margins suggest a defensible business. Margins that swing wildly with commodity prices or fashion cycles suggest you are buying a coin flip.
- Capex-heavy industries. Airlines, steel, telecoms, miners. These businesses can earn record profits and still produce no free cash flow because they have to spend it all on maintenance. Capex-light businesses (software, consumer brands, financial data) tend to compound shareholder value more reliably.
- Acquisitive serial inflators. Companies that grow only through acquisitions usually have goodwill ballooning on the balance sheet and write-downs five years later. Check whether revenue per share is growing alongside total revenue.
Graham's filters are different in flavour but similar in intent: he wanted a strong current ratio, modest debt, a long history of dividends, and a price well below conservatively-calculated value. The Graham angle is covered in more depth in the Intelligent Investor review.
Using Financial Statements Inside an ISA or SIPP
For a UK investor stock-picking inside a Stocks and Shares ISA or SIPP, the practical workflow is:
- Generate a shortlist of 10-15 names from a sector you understand (your circle of competence).
- Run all of them through the five-ratio screen above. Reject anything that fails three or more.
- For the survivors, pull the last five annual reports and read the cash flow statement first, the income statement second, the balance sheet third.
- Write up an investment thesis for the two or three you actually want to own. If you cannot write the thesis in 300 words, you do not understand the business well enough.
- Position-size accordingly. Inside an ISA, the £20,000 annual subscription limit imposes natural discipline. Inside a SIPP, treat individual stock positions as a tilt around a passive core.
The point is not to find the next Apple. It is to filter out the obvious losers and only act on the names that survive the screen.
Frequently Asked Questions
How do I find financial statements for a UK-listed company?
Start with the investor relations page of the company's own website, which hosts annual report PDFs and half-year results. For the freshest filings, check RNS announcements on the London Stock Exchange. For private UK companies, Companies House holds free, public filings.
What ratios should I look at first?
Start with five: return on equity (above 15% is good), debt-to-equity (below 0.5 for most non-financials), operating margin (look at the five-year trend), free cash flow yield (above 5% is attractive), and interest cover (above 4x is comfortable). These five reject most weak businesses before you waste time on them.
Why does free cash flow matter more than net profit?
Net profit is calculated under accounting rules that allow management some discretion over when to book revenue and how to depreciate assets. Free cash flow is what is actually in the bank. A business with strong reported profit but weak cash flow is either bad at collecting from customers or aggressive with its accounting. Cash is the audit on the earnings.
Can I use Buffett's filters as a UK investor?
Yes, but treat them as one input among several. The principles travel (look for pricing power, avoid heavy debt, prefer capex-light businesses). Buffett's actual implementation does not - he buys whole companies, sits on boards, and has insurance float to deploy. Borrow his screens, not his life.
How long does it take to learn this properly?
A weekend of reading and a year of practice. Pick five FTSE 100 firms you already know as a consumer, download their annual reports, and force yourself to write a one-paragraph summary of each one based purely on the numbers. By the fifth, the patterns start jumping out. By the twentieth, you will have a working filter.
Further Reading:
The Intelligent Investor - Benjamin Graham - Graham wrote the playbook for analysing securities through the lens of price versus conservatively-calculated value. Buffett calls it the best investment book ever written. (Affiliate link - we may earn a small commission at no extra cost to you.)
The Little Book of Common Sense Investing - John Bogle - The honest counterweight. If after learning to read statements you decide stock picking is not for you, Bogle makes the case for the index alternative better than anyone. (Affiliate link - we may earn a small commission at no extra cost to you.)
Read Next
Enjoying the content?
If this site has been useful, a coffee goes a long way.
Browse more articles
Browse all