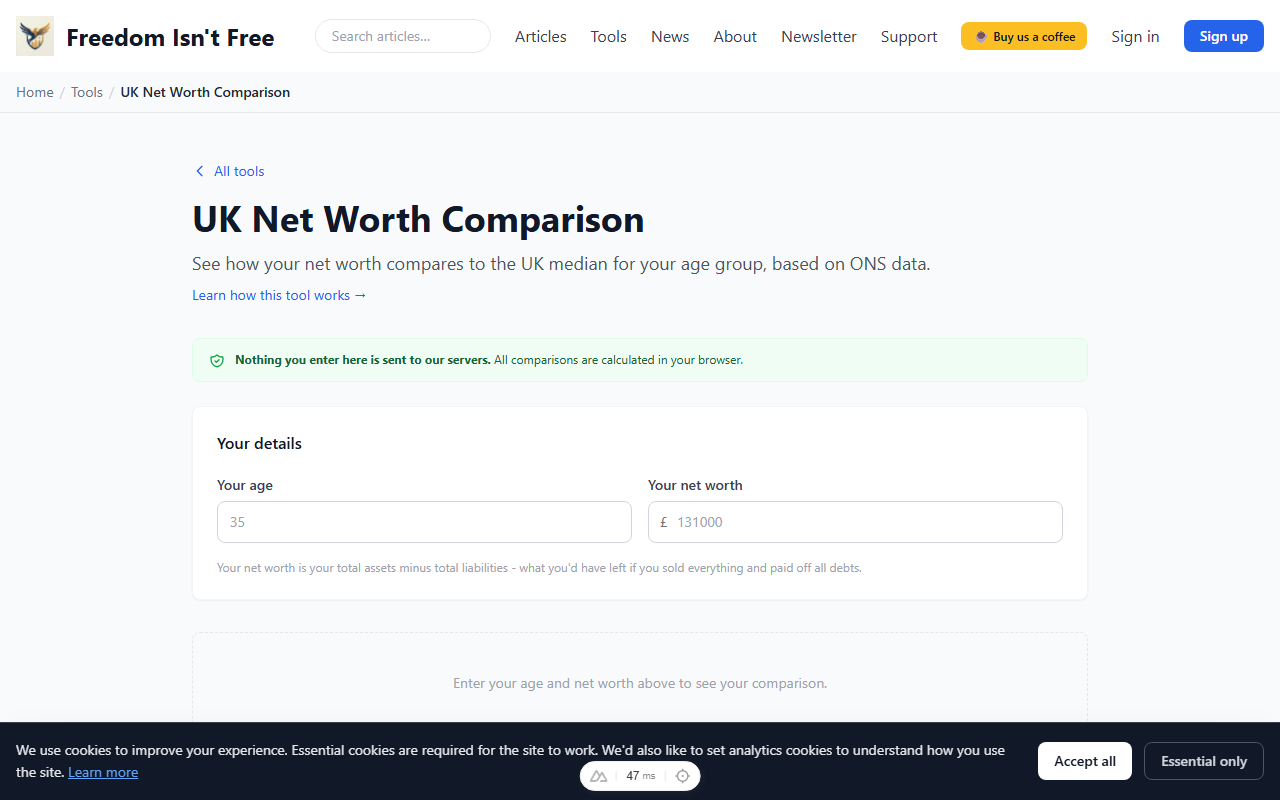
UK Net Worth Comparison
See how your net worth compares to the UK median for your age group, based on ONS data.
Your details
Your net worth is your total assets minus total liabilities - what you'd have left if you sold everything and paid off all debts.
What happens to my data?
Difference vs the UK median
£0
Cohort median (35-44)
£131,000
Your net worth
£131,000
vs median
0%
Median net worth by age group
35-44 year olds: Rising property equity and pension value.
Source: ONS Wealth and Assets Survey, Wave 7 (2018-2020). Figures are median individual total wealth (property + financial + physical + private pension wealth, minus liabilities).
The complete guide
UK Net Worth Comparison: How Do You Stack Up?
Compare your net worth to the UK median for your age group using ONS data. Our free tool shows where you stand and what the typical household looks like.
Most people have no idea whether their savings and assets are above average, below average, or somewhere in between. It is one of those subjects we simply do not talk about in the UK. Your mates will tell you what they paid for their car but rarely what sits in their pension.
That silence makes it hard to know if you are on track. Are you doing well for your age, or have you fallen behind without realising it? Our UK net worth comparison tool answers that question in seconds, using real data from the Office for National Statistics.
Contents
- Why Comparing Your Net Worth Matters
- How to Use the Tool
- What the ONS Data Shows
- What Counts in the ONS Definition
- Common Reasons You Might Be Above the Median
- Common Reasons You Might Be Below the Median
- Using This as Motivation, Not a Comparison Trap
- Frequently Asked Questions
Why Comparing Your Net Worth Matters
Net worth is the single best snapshot of your financial health. It captures everything - your savings, investments, property, and pension - minus everything you owe. Unlike income alone, it tells you what you have actually kept.
Knowing where you sit relative to others your age can be genuinely useful:
- Reality check. You might feel behind because your salary is lower than a friend's, yet your net worth could be higher because you save more and spend less. The reverse is also true.
- Goal setting. If the median for your age group is higher than your current position, that gives you a concrete target to work towards.
- Motivation. Seeing progress over time, especially when tracked alongside a net worth tracker, keeps you focused.
Why It Does Not Tell the Whole Story
Comparison has limits. A 35-year-old in London paying sky-high rent is playing a different game to someone the same age who inherited a house in the Midlands. Household size, regional cost of living, career stage, and plain luck all play a part. The median is a reference point, not a scorecard.
Use it to inform your decisions, not to judge yourself.
How to Use the Tool
The UK net worth comparison tool is free and takes less than a minute.
- Enter your age. The tool matches you to the correct ONS age band automatically.
- Enter your net worth. If you are not sure of the exact figure, a rough estimate works fine. Add up your property equity, pensions, savings, and investments, then subtract any debts. Our net worth tracker can help you calculate this properly.
- View your result. The tool shows the UK median net worth for your age group and tells you whether you are above or below it, and by how much.
If you are logged in and have already filled out your financial profile, the tool can pre-fill your details so you do not have to enter them again. Every calculation happens in your browser - nothing is sent to a server.
What the ONS Data Shows
The figures below come from the ONS Wealth and Assets Survey, Wave 7 (2018-2020), which covers Great Britain. These are approximate median individual total wealth values, meaning half of individuals in each group have more and half have less. Figures are indicative and rounded; check the latest ONS release for current values.
| Age Group | Median Net Worth (approx.) |
|---|---|
| 16-24 | £15,300 |
| 25-34 | £44,700 |
| 35-44 | £131,000 |
| 45-54 | £224,800 |
| 55-64 | £380,100 |
| 65-74 | £355,800 |
| 75+ | £281,400 |
A few things stand out. Net worth rises sharply through the working years, driven mainly by property equity and pension growth. It then dips slightly after 65 as people draw down their pensions and, in some cases, downsize or gift money to family.
UK median individual net worth by age band
Property equity and pensions stack through working life, then drawdown bites after 65.
Source: ONS Wealth and Assets Survey, Wave 7 (2018-2020), Great Britain. Median individual total wealth (property, private pension, financial and physical, minus liabilities).
The jump between the 25-34 band and the 35-44 band is where property ownership and sustained pension contributions start to show their effect. If you are in your late twenties and feeling behind, remember that compound growth has barely started working for you yet. Try running the numbers through our compound interest calculator to see how even modest monthly contributions grow over two or three decades.
What Counts in the ONS Definition
The ONS definition of total wealth is broader than most people expect. It includes four components:
- Property wealth. The value of your main home and any other property, minus any mortgage debt.
- Private pension wealth. The current value of all defined contribution pots plus the estimated value of any defined benefit entitlements. This is often the largest single component for people over 45.
- Financial wealth. Cash savings, ISAs, shares, and other investments, minus financial debts like credit cards and personal loans.
- Physical wealth. Household contents, vehicles, and valuables. This is usually the smallest portion.
Many people forget to include their pension when they think about net worth, which can make them feel far worse off than they actually are. A workplace pension you have been contributing to for 15 years could easily be worth six figures, yet it is out of sight and out of mind.
On the other hand, the ONS figure does not include the state pension. If you have a full National Insurance record, the state pension is worth a significant income stream in retirement, but it does not appear in these numbers.
Common Reasons You Might Be Above the Median
- You got on the property ladder early. House price growth over the last 20 years has been the single biggest wealth builder for many UK households.
- You have been auto-enrolled into a decent workplace pension. Employer contributions are a meaningful boost on top of your own, and they add up over time.
- You live below your means. High earners with high spending often have lower net worth than moderate earners who save consistently. This is one of the central themes in The Millionaire Next Door, and it applies just as much in the UK as in the US.
- You received an inheritance or financial gift. This is a growing factor in UK wealth inequality.
Common Reasons You Might Be Below the Median
- You rent rather than own. Without property equity, one of the largest components of typical UK wealth is missing from your balance sheet.
- You carry significant debt. Student loans, car finance, and credit card balances all drag your net worth down.
- You started saving late. There is no shame in this, but compound growth needs time to work.
- You live in a high-cost area. London and the South East eat into disposable income, leaving less to save even on a higher salary.
- Career breaks. Time out for caring responsibilities, illness, or retraining means fewer years of pension contributions and earnings.
None of these things are permanent. The value of knowing where you stand is that you can make a plan. If you want to work out how much you need to reach financial independence, our FI number calculator is a good next step.
Using This as Motivation, Not a Comparison Trap
Social media is full of people sharing their net worth milestones, and it is easy to feel like everyone else is racing ahead. Remember a few things:
The median is just the middle. Half of all households are below it. Being below average at 28 does not mean you will be below average at 48, especially if you take action now.
Your trajectory matters more than your position. Someone whose net worth has grown by 30% in the last two years is in a stronger position than someone with a higher total who is heading in the wrong direction.
Focus on what you can control. You cannot control house prices, interest rates, or the stock market. You can control your savings rate, your spending habits, and whether you are taking advantage of tax-efficient accounts like ISAs and pensions.
Check in on your position once or twice a year. Track it over time. Celebrate the upward trend rather than fixating on how you compare to a stranger on the internet.
Ready to see where you stand? Try the UK net worth comparison tool and find out in under a minute.
Further Reading:
The Millionaire Next Door - Stanley & Danko - The definitive study on how real wealth is built through consistent saving, not high income - and why the typical millionaire looks nothing like you would expect. (Affiliate link - we may earn a small commission at no extra cost to you.)
The Psychology of Money - Morgan Housel - A brilliant look at why we compare ourselves to others financially and how to focus on what actually matters for your own wealth journey. (Affiliate link - we may earn a small commission at no extra cost to you.)
Read Next
Frequently asked questions
Where does the comparison data come from?
Does the comparison include my house?
Why does the median jump so much between age bands?
I am below the median. Should I panic?
Does the tool store the figures I enter?
What is investing net worth and why does it matter more?
Is this tool free to use?
Related reading
Net worth tracker
Log your figures over time and watch the trajectory build.
How to calculate your UK net worth
The line items most readers under- or over-count.
Your UK FIRE number
Where your net worth needs to land for the maths to work.
Why FIRE is harder in the UK than the US
The structural reasons UK numbers look the way they do.