FI Number Calculator UK
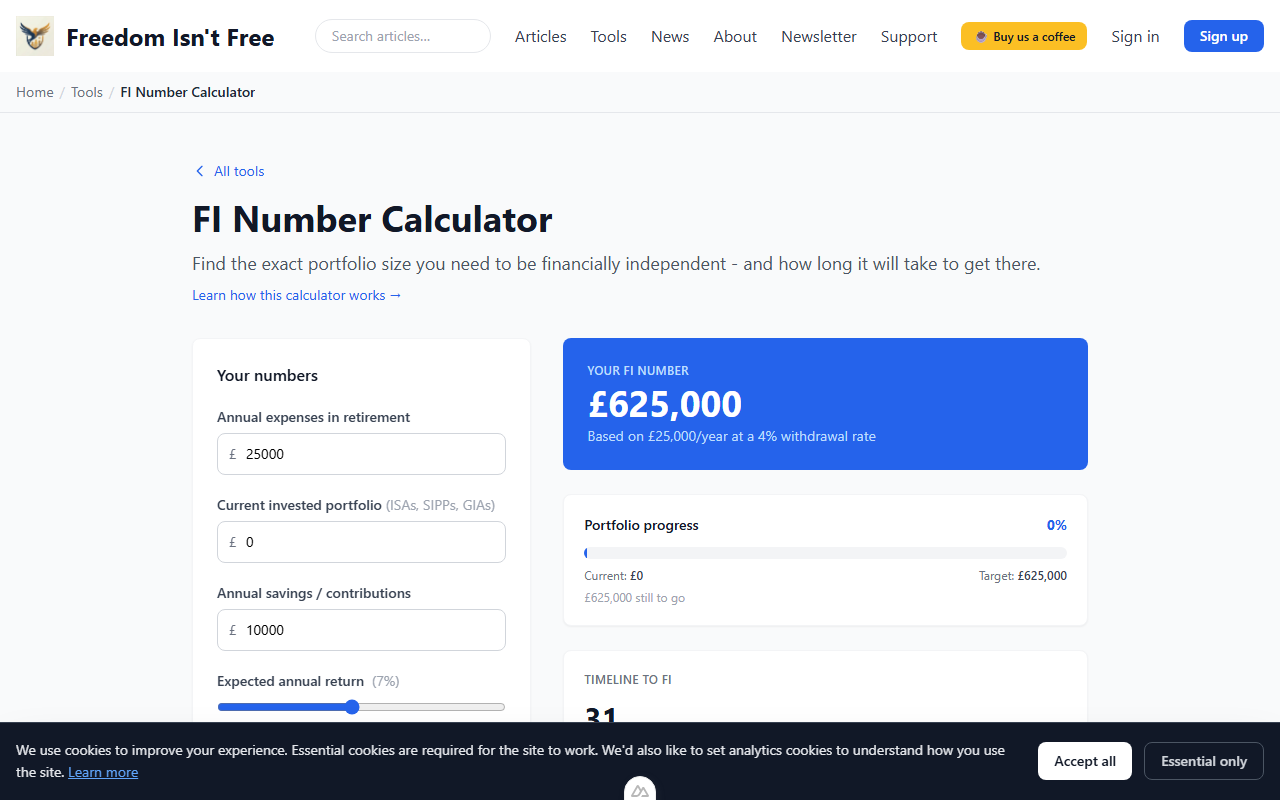
Find the exact portfolio size you need to be financially independent - and how long it will take to get there.
Your numbers
How much you expect to spend each year in retirement, including housing, bills, food, and leisure. Exclude mortgage if it will be paid off.
The total value of all your invested assets today. Include ISAs, pensions (SIPPs), and general investment accounts. Exclude property, cash savings, and emergency funds.
How much you add to your investments each year, including pension contributions (employee + employer) and ISA deposits.
The nominal (before inflation) return you expect. Global equity trackers have broadly delivered 7-10% per year over long historical periods, but past returns are not a guide to future performance.
The Bank of England targets 2%. Higher inflation means your money buys less each year, so you need a larger pot.
Real return: 4.4% · All figures in today's money.
What happens to my data?
Your FI number
£625,000
Years to FI
31 yrs
Progress
0%
Based on £25,000/year at a 4% withdrawal rate.
Timeline to FI
31
years
Age 61
target retirement age
Portfolio progress
0%£625,000 still to go
Portfolio projection
How your savings rate affects the timeline
Saving more shortens your path to FI - often faster than chasing higher returns.
| Annual savings | Monthly | Years to FI | Retire at |
|---|---|---|---|
| £5,000 | £417 | 44 | Age 74 |
| £7,500 | £625 | 36 | Age 66 |
| £10,000 current | £833 | 31 | Age 61 |
| £15,000 | £1,250 | 25 | Age 55 |
| £20,000 | £1,667 | 21 | Age 51 |
Want to understand the maths?
Read: The Ransom Price - Calculating Your Financial Independence NumberThe article behind the calculator. How the 4% rule works and why it matters.
Year-by-year breakdown
Embed this calculator on your site
Paste this snippet wherever you'd like the calculator to appear. Free to use, no account required, attribution preserved.
<iframe
  src="https://freedomisntfree.co.uk/tools/fi-number-calculator?embed=1"
  width="100%"
  height="780"
  style="border: 1px solid #e5e7eb; border-radius: 12px; max-width: 720px;"
  loading="lazy"
  title="Freedom Isn't Free calculator"
  referrerpolicy="no-referrer-when-downgrade"
></iframe> The iframe auto-resizes to fit content if your page listens for fif-embed-resize postMessage events.
The complete guide
FI Number Calculator: Your Independence Target
Calculate exactly how much you need to retire early. Our free FI number calculator shows your target portfolio size and time to financial independence.
Financial independence starts with a single number. Not a vague hope, not a rough guess, but a hard target you can plan around and track over time. Your FI number is the portfolio size at which your investments can cover your living costs indefinitely, freeing you from the need to work for money.
Our FI number calculator does the maths for you. Enter your annual expenses, current savings, and expected returns, and it tells you exactly how much you need and how long it will take to get there.
Contents
- What Is a FI Number?
- How to Use the Calculator
- Common Use Cases
- How Savings Rate Affects Time to FI
- Adjustments for UK Investors
What Is a FI Number?
Your FI number is the total amount of invested capital you need before you can live off your portfolio's returns. It is based on the 4% rule. The original Trinity Study finding suggested that, over a 30-year US retirement, a 4% starting withdrawal adjusted for inflation each year had a high historical success rate in the data tested. The "roughly 95% success" headline is a simplification of that backtest, not a forward guarantee, and outcomes for any individual depend on real-world returns, sequencing, fees, and tax.
The calculation is simple: multiply your expected annual expenses in retirement by 25.
FI Number = Annual Expenses x 25
If you plan to spend £30,000 per year, your FI number is £750,000. If you need £40,000, you are targeting £1,000,000. The 25x multiplier is just the inverse of the 4% withdrawal rate - nothing more complicated than that.
For a deeper look at how this rule was derived and what its limitations are, read our full breakdown on calculating your FIRE number. And if you want to understand why UK investors may need to adjust that 4% figure, our review of Beyond the 4% Rule covers the evidence.
How to Use the Calculator
The FI number calculator is designed to give you a clear answer in under a minute. Here is how to use it step by step.
1. Enter Your Annual Expenses
Start with what you expect to spend each year in retirement. If you are not sure, look at your last 12 months of bank statements and subtract costs that disappear when you stop working (commuting, work lunches, professional clothing). Our budgeting 101 guide can help you build an accurate picture of your spending.
2. Add Your Current Portfolio Value
Enter the total value of your invested assets. This includes ISAs, SIPPs, GIAs, and any other investments you plan to draw from in retirement. If you are not sure of the total, use the net worth tracker to get an up-to-date figure.
3. Set Your Annual Savings
How much are you putting away each year? This is the amount going into investments, not just sitting in a savings account. The calculator uses this figure alongside your expected return rate to project how quickly your portfolio will grow.
4. Choose Your Expected Return Rate
A common modelling assumption is 7-8% nominal or 4-5% real (after inflation). The calculator lets you adjust this to match your own expectations. Global equity indices have delivered real returns broadly around 5% over long historical periods, though past performance is not a guide to future returns. Use the compound interest calculator to see how different return assumptions change your projections over time.
5. Review Your Results
The calculator shows your FI number, your current progress as a percentage, and the estimated number of years until you reach financial independence at your current savings rate. It also includes a reverse mode where you can enter a target retirement age and see what savings rate you would need to hit that deadline.
6. Choose Your Portfolio Type
The tool supports ISA, SIPP, and GIA portfolio types, so you can see how each wrapper affects your path to FI. This matters because SIPP contributions come with tax relief, while ISA withdrawals are tax-free. The right mix depends on your income, your planned retirement age, and whether you want access to funds before 57.
7. Save to Your Profile
If you are logged in, you can save your inputs to your financial profile. This means you can come back and update your numbers as your situation changes without starting from scratch each time.
Common Use Cases
Early Retirement Planning
The most common reason to calculate a FI number is to plan for early retirement. If you want to stop working at 45 or 50, you need a clear target and a timeline. The calculator shows whether your current savings rate is enough, or whether you need to increase contributions, reduce expenses, or both.
Setting Savings Targets
Once you know your FI number, you can work backwards to a monthly savings target. If you need £750,000 in 15 years and you have £100,000 today, the calculator will show you exactly how much to save each month to close that gap at a given return rate.
Comparing Scenarios
Run the calculator multiple times with different inputs. What happens if you cut expenses by £5,000 a year? What if you increase your savings rate by 5%? What if returns are lower than expected? Comparing scenarios helps you build a plan that works even if things do not go perfectly.
How Savings Rate Affects Time to FI
Your savings rate is the single most important variable in reaching financial independence. It matters more than investment returns, more than income, and more than clever tax planning. A higher savings rate works in two directions at once: it increases the money flowing into your portfolio and it reduces the expenses your portfolio needs to cover.
Here is how savings rate affects the number of years to reach FI, assuming a 5% real return and starting from zero.
| Savings Rate | Years to FI |
|---|---|
| 10% | 51 |
| 20% | 37 |
| 30% | 28 |
| 40% | 22 |
| 50% | 17 |
| 60% | 12.5 |
| 70% | 8.5 |
| 80% | 5.5 |
Plotted out, the curve makes the point more forcefully than the table does.
Years to financial independence by savings rate
Source: Mr Money Mustache - The Shockingly Simple Math Behind Early Retirement (5% real return, 4% withdrawal)
The relationship is not linear. Moving from a 10% to a 20% savings rate shaves off 14 years. Moving from 70% to 80% only saves 3 years. The biggest gains come from getting your savings rate above 30-40%, where the timeline starts to compress dramatically.
Adjustments for UK Investors
The standard FI number formula works globally, but UK investors have two major advantages worth building into their plans.
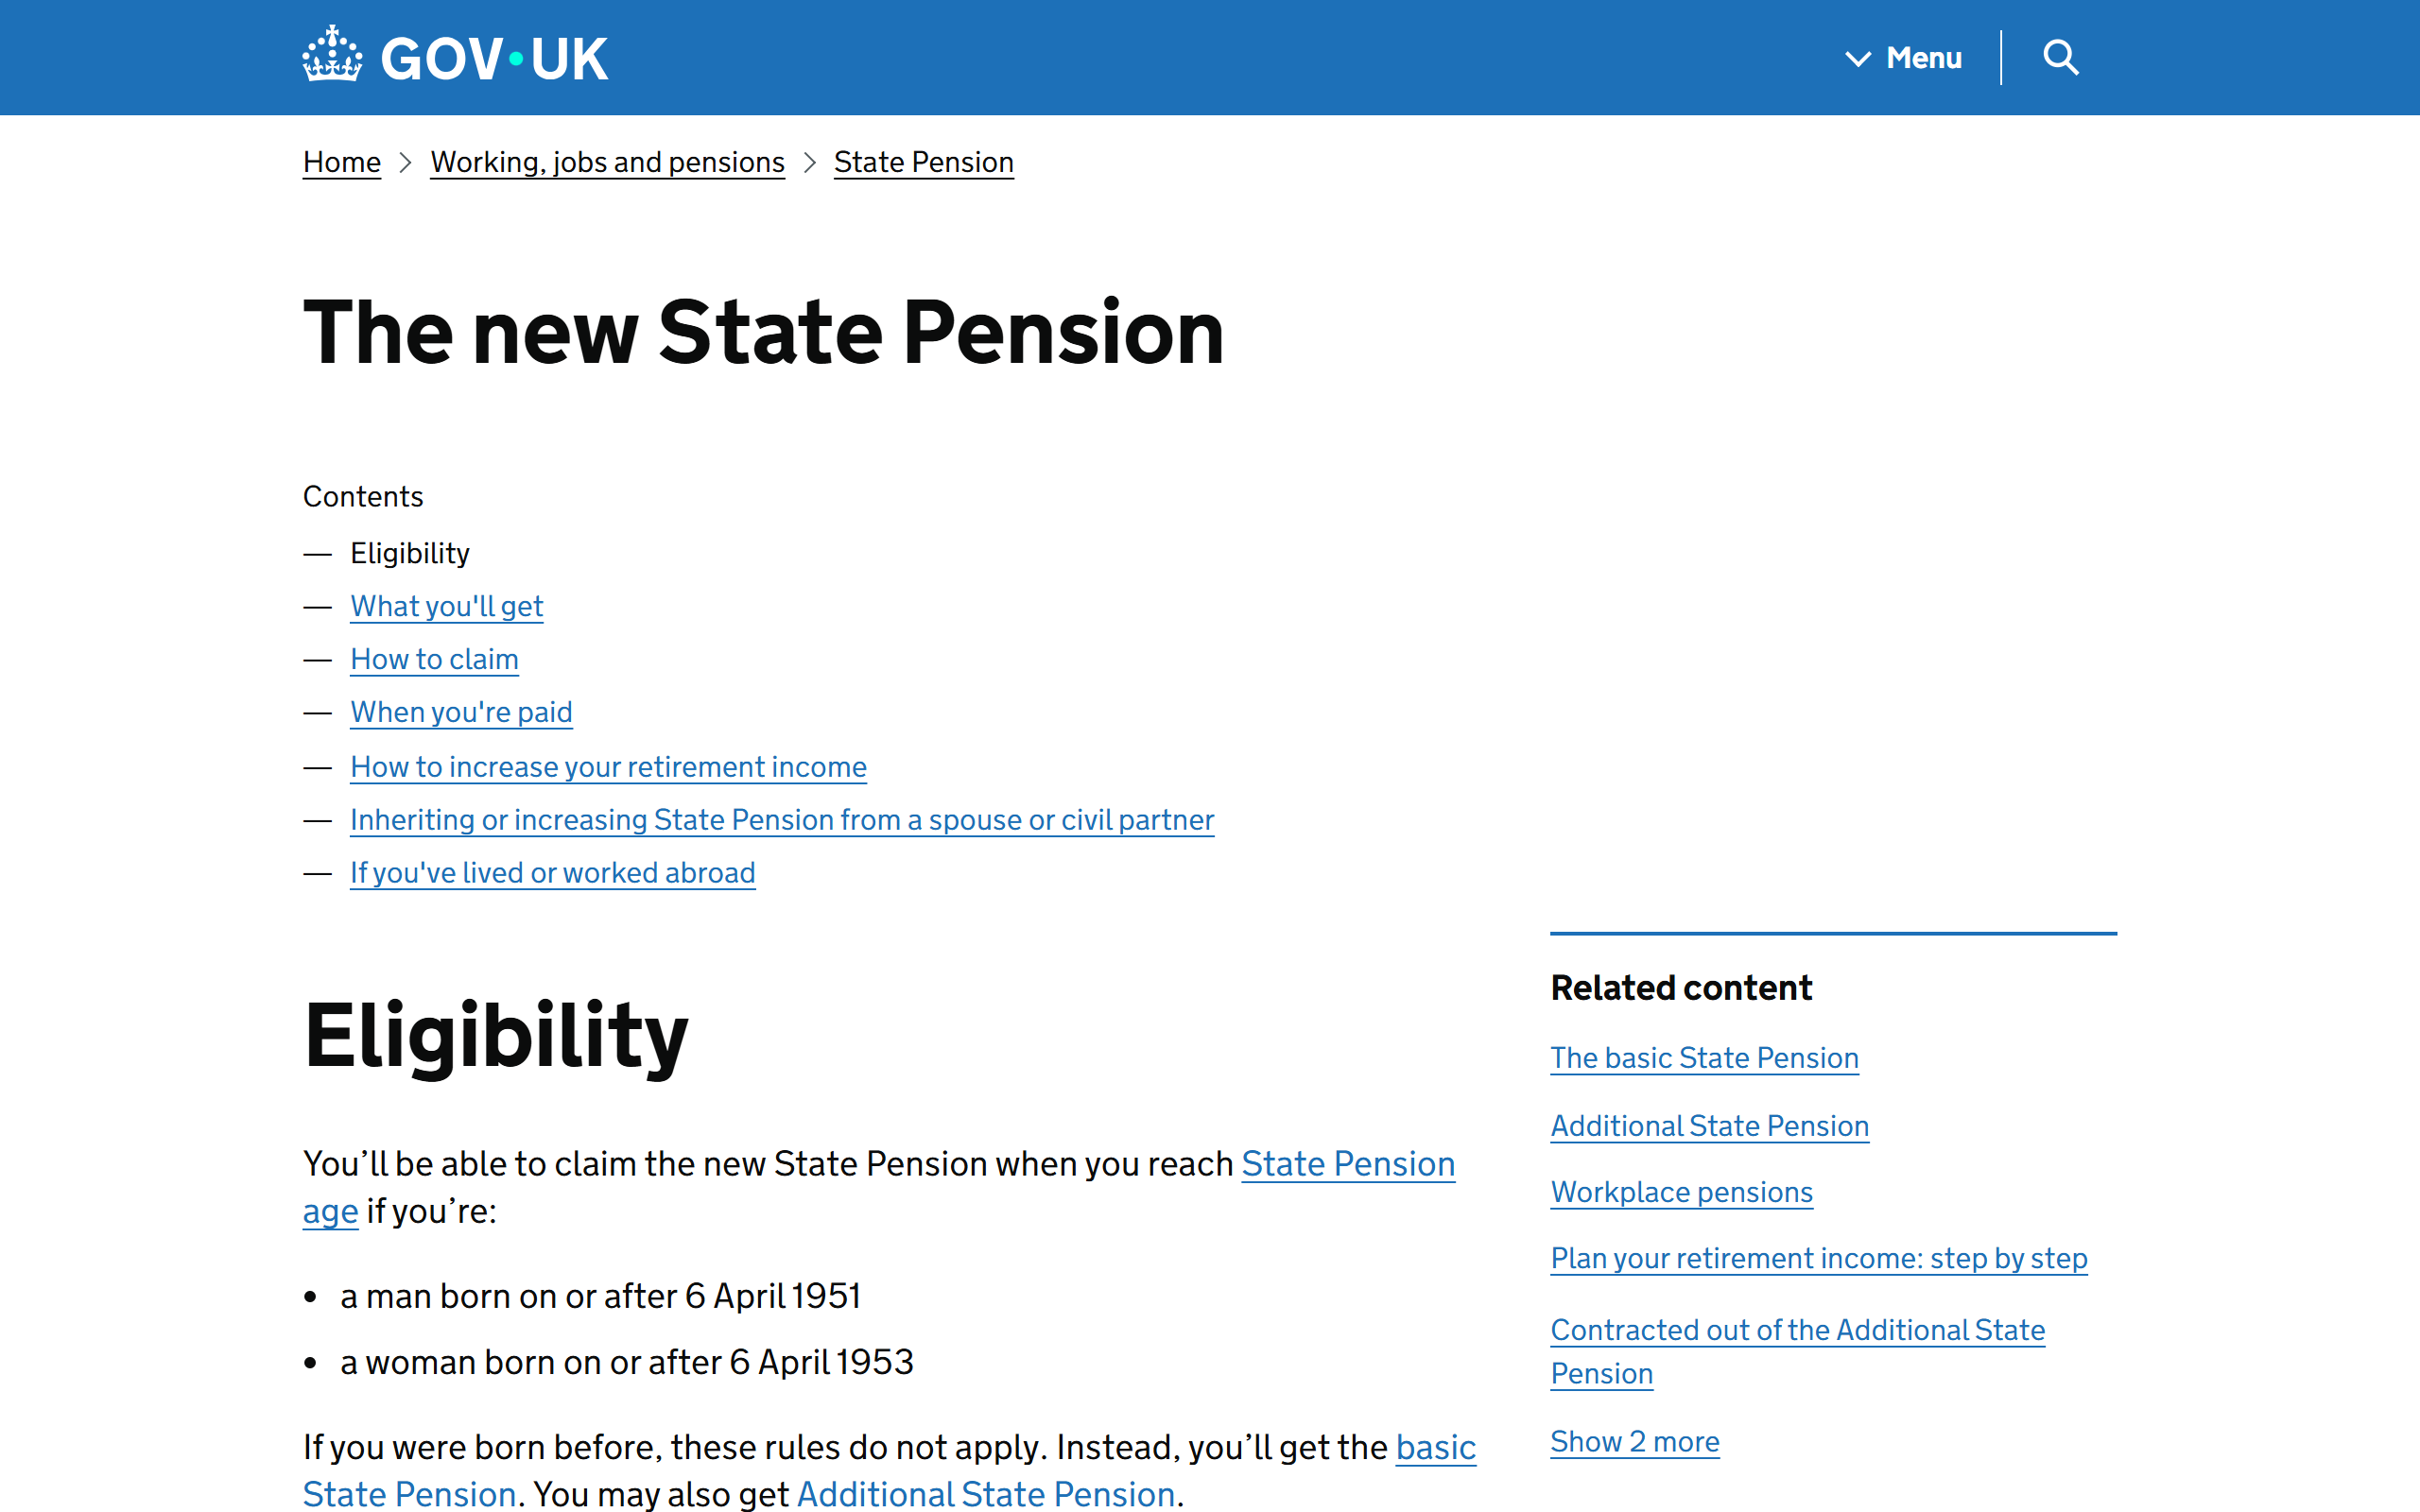
State Pension Bridging
If you retire early, you will not receive the State Pension until age 66 (rising to 67 and eventually 68). But once it kicks in, the full new State Pension pays around £11,500 per year. That reduces your required portfolio withdrawals significantly.
This means your true FI number has two phases. Before State Pension age, your portfolio needs to cover all your expenses. After State Pension age, it only needs to cover the gap between your pension income and your total spending. The calculator helps you plan for both phases.
ISA and SIPP Sequencing
UK investors have access to two powerful tax-advantaged wrappers, and the order in which you draw from them matters.
- SIPPs offer upfront tax relief (20% or 40% depending on your marginal rate) and tax-free growth, but you cannot access funds until age 57 (from April 2028). Withdrawals are taxed as income.
- ISAs offer no upfront tax relief, but growth and withdrawals are completely tax-free with no age restriction.
- GIAs (General Investment Accounts) have no tax advantages but no restrictions either.
A common strategy is to live off ISA and GIA funds in early retirement, then switch to SIPP withdrawals once you reach pension age. This keeps your taxable income low in the early years while your SIPP continues to grow tax-free. Running separate scenarios for each wrapper in the calculator helps you see how this sequencing affects your timeline.
A Note on Risk and Advice
This guide and calculator are general information for UK readers, not personal financial advice or a recommendation to invest in any specific product. Investing puts your capital at risk; the value of investments can fall as well as rise and you may get back less than you put in. The 4% rule, the 25x multiplier, and the savings-rate scenarios shown here are modelling tools based on historical data, not promises about future outcomes. Tax rules, State Pension entitlement, and pension access ages change over time. For advice tailored to your circumstances, speak to an FCA-regulated financial adviser.
Start Calculating
Your FI number is not a fantasy figure. It is a concrete, calculable target. Once you know what it is, every pound you save and invest moves you measurably closer.
Try the FI number calculator and find out exactly where you stand.
Further Reading:
Quit Like a Millionaire - Kristy Shen - A practical guide to reaching financial independence and retiring early, with clear worked examples on calculating your FI number and optimising your savings rate. (Affiliate link - we may earn a small commission at no extra cost to you.)
The Psychology of Money - Morgan Housel - Explores why behaviour and mindset matter more than spreadsheets on the path to financial independence. (Affiliate link - we may earn a small commission at no extra cost to you.)
Read Next
Frequently asked questions
How do you calculate your FI number?
Is the 4% rule safe for early retirees in the UK?
Should I include my house in my FI number?
How does the State Pension change my FI number?
Does the FI number account for inflation?
What is a good savings rate to aim for?
Worked examples by age
See the FI number worked through for a typical UK saver at different starting ages, each pre-filled with realistic figures you can then tweak.
Related reading
Belt and braces investing: one global tracker
How to deploy the contributions this calculator suggests, without overcomplicating it.
Nutmeg / J.P. Morgan Personal Investing
If you do not want to pick funds yourself: an honest review of the largest UK robo-advisor.
Sequence-of-returns risk
Why the first five years of retirement carry more risk than any other period.
Safe withdrawal rate UK
Why the 4% rule under-delivers for UK retirees and what Wade Pfau suggests instead.