


How to Tell If Your Investment Plan Is Working
Up 4% this year could be a disaster. Down 8% could be exactly right. The broker app's number is meaningless without a benchmark, and the benchmark almost no one is honest about.
Cite this article
Freedom Isn't Free (2026) How to Tell If Your Investment Plan Is Working. Available at: https://freedomisntfree.co.uk/articles/is-my-investment-plan-working (Accessed: 22 June 2026).
Italicise the article title in your bibliography. Accessed date set to today.
TLDR
- You cannot judge an investment plan without a thesis. Write down what you own and why before you measure anything, otherwise you are just looking at numbers in a vacuum.
- The benchmark almost everyone is trying to beat is the S&P 500, which has averaged around 10% per year over the long run. If your portfolio is consistently below that, you have to ask why.
- Total return is the only number that matters. That means dividends reinvested plus capital growth, not just the share price you see on your broker app.
- A single year tells you almost nothing. You need at least three to five years of data, ideally more, before you can fairly judge whether your plan is working.
Long-run annualised total returns
Beat the S&P 500 over 5+ years and you are in rare company.
How to Tell If Your Investment Plan Is Working
You cannot tell if your investment plan is working by logging into your broker and feeling something. Either smug or sick. The number on its own tells you almost nothing. Up 4% this year could be a disaster. Down 8% could be perfectly fine. Without context, you are just reading tea leaves.
This is for anyone who has been investing for a year or two, has a mixed bag of funds, ETFs and maybe a few individual stocks, and genuinely does not know if they are doing well or not. The honest answer takes about ten minutes to work out, and the framework is the same whether you have a thousand pounds or a hundred thousand.
Contents
- Start with a thesis, or you have nothing to measure
- Total return is the only number that counts
- The S&P 500 is the benchmark everyone is trying to beat
- Why one year of data tells you almost nothing
- What to do if you are underperforming
- Frequently asked questions
Start With a Thesis, or You Have Nothing to Measure
Before you can tell if your investment plan is working, you need to admit whether you actually have a plan. Most people do not. They have a portfolio, which is different. A portfolio is a list of things you bought. A plan is a written reason for owning each of those things, and a target you expect them to hit.
If your holdings look like Apple, a UK dividend ETF, some Tesla, a global tracker, that crypto your mate told you about, and a couple of investment trusts, you have a bucket, not a strategy. That is fine, most people start there. But you cannot fairly judge whether a bucket is "working" because the bucket has no goal.
Write down, in one paragraph, the answer to two questions:
- What am I trying to achieve, and over what time horizon? Retirement in 30 years. A house deposit in 7. Financial independence by 55. Be specific.
- What return do I need from this money to get there? Use a compound interest calculator and work backwards from your goal.
If you have never written one of these, our guide on how to write your investment thesis walks through the process in more detail. Now you have a target. The rest of this article is about whether you are on track to hit it.
Total Return Is the Only Number That Counts
Most beginners look at the share price, see it has gone up 6%, and call it a 6% return. That is wrong, and it is wrong in a way that quietly costs you years of compounding.
The number that matters is total return, which is the combination of two things:
- Capital growth. The change in the price of the asset.
- Dividends. The cash the company or fund pays out to shareholders.
A FTSE 100 tracker might only grow 2-3% in price over a year, which sounds rubbish. But it might also pay out a 4% dividend yield. If those dividends are reinvested, your real return is closer to 6-7%. Ignoring the dividend half of that equation is like measuring a footballer on shots taken and refusing to count goals.
Most broker platforms quietly default to showing you price-only returns. Hargreaves Lansdown, AJ Bell, Trading 212, Vanguard, all of them. To see your real performance, you usually need to dig into a "total return" or "performance" view that includes distributions. If your platform does not show this, calculate it yourself: take the value today, add any dividends paid out (or that have been auto-reinvested into more units), and compare against what you put in.
The same rule applies when comparing against any benchmark. The S&P 500 price chart is not the same as the S&P 500 total return. Over the past 30 years, dividends reinvested have added roughly 2 percentage points per year on top of pure price growth. That compounds into a huge difference.
If you take one thing from this article, take this: always compare total return to total return. Anything else is cheating yourself or flattering yourself, and neither helps.
The S&P 500 Is the Benchmark Everyone Is Trying to Beat
Here is the uncomfortable truth that the active fund management industry would rather you did not know: the gold standard benchmark for equity investing is the S&P 500, the index of the 500 largest companies listed on US stock exchanges. Almost every professional fund manager in the world is, implicitly or explicitly, judged against it. And most of them lose. The SPIVA scorecards from S&P Dow Jones Indices have shown for two decades that around 80-90% of actively managed funds fail to beat their benchmark over 10-year periods, after fees.
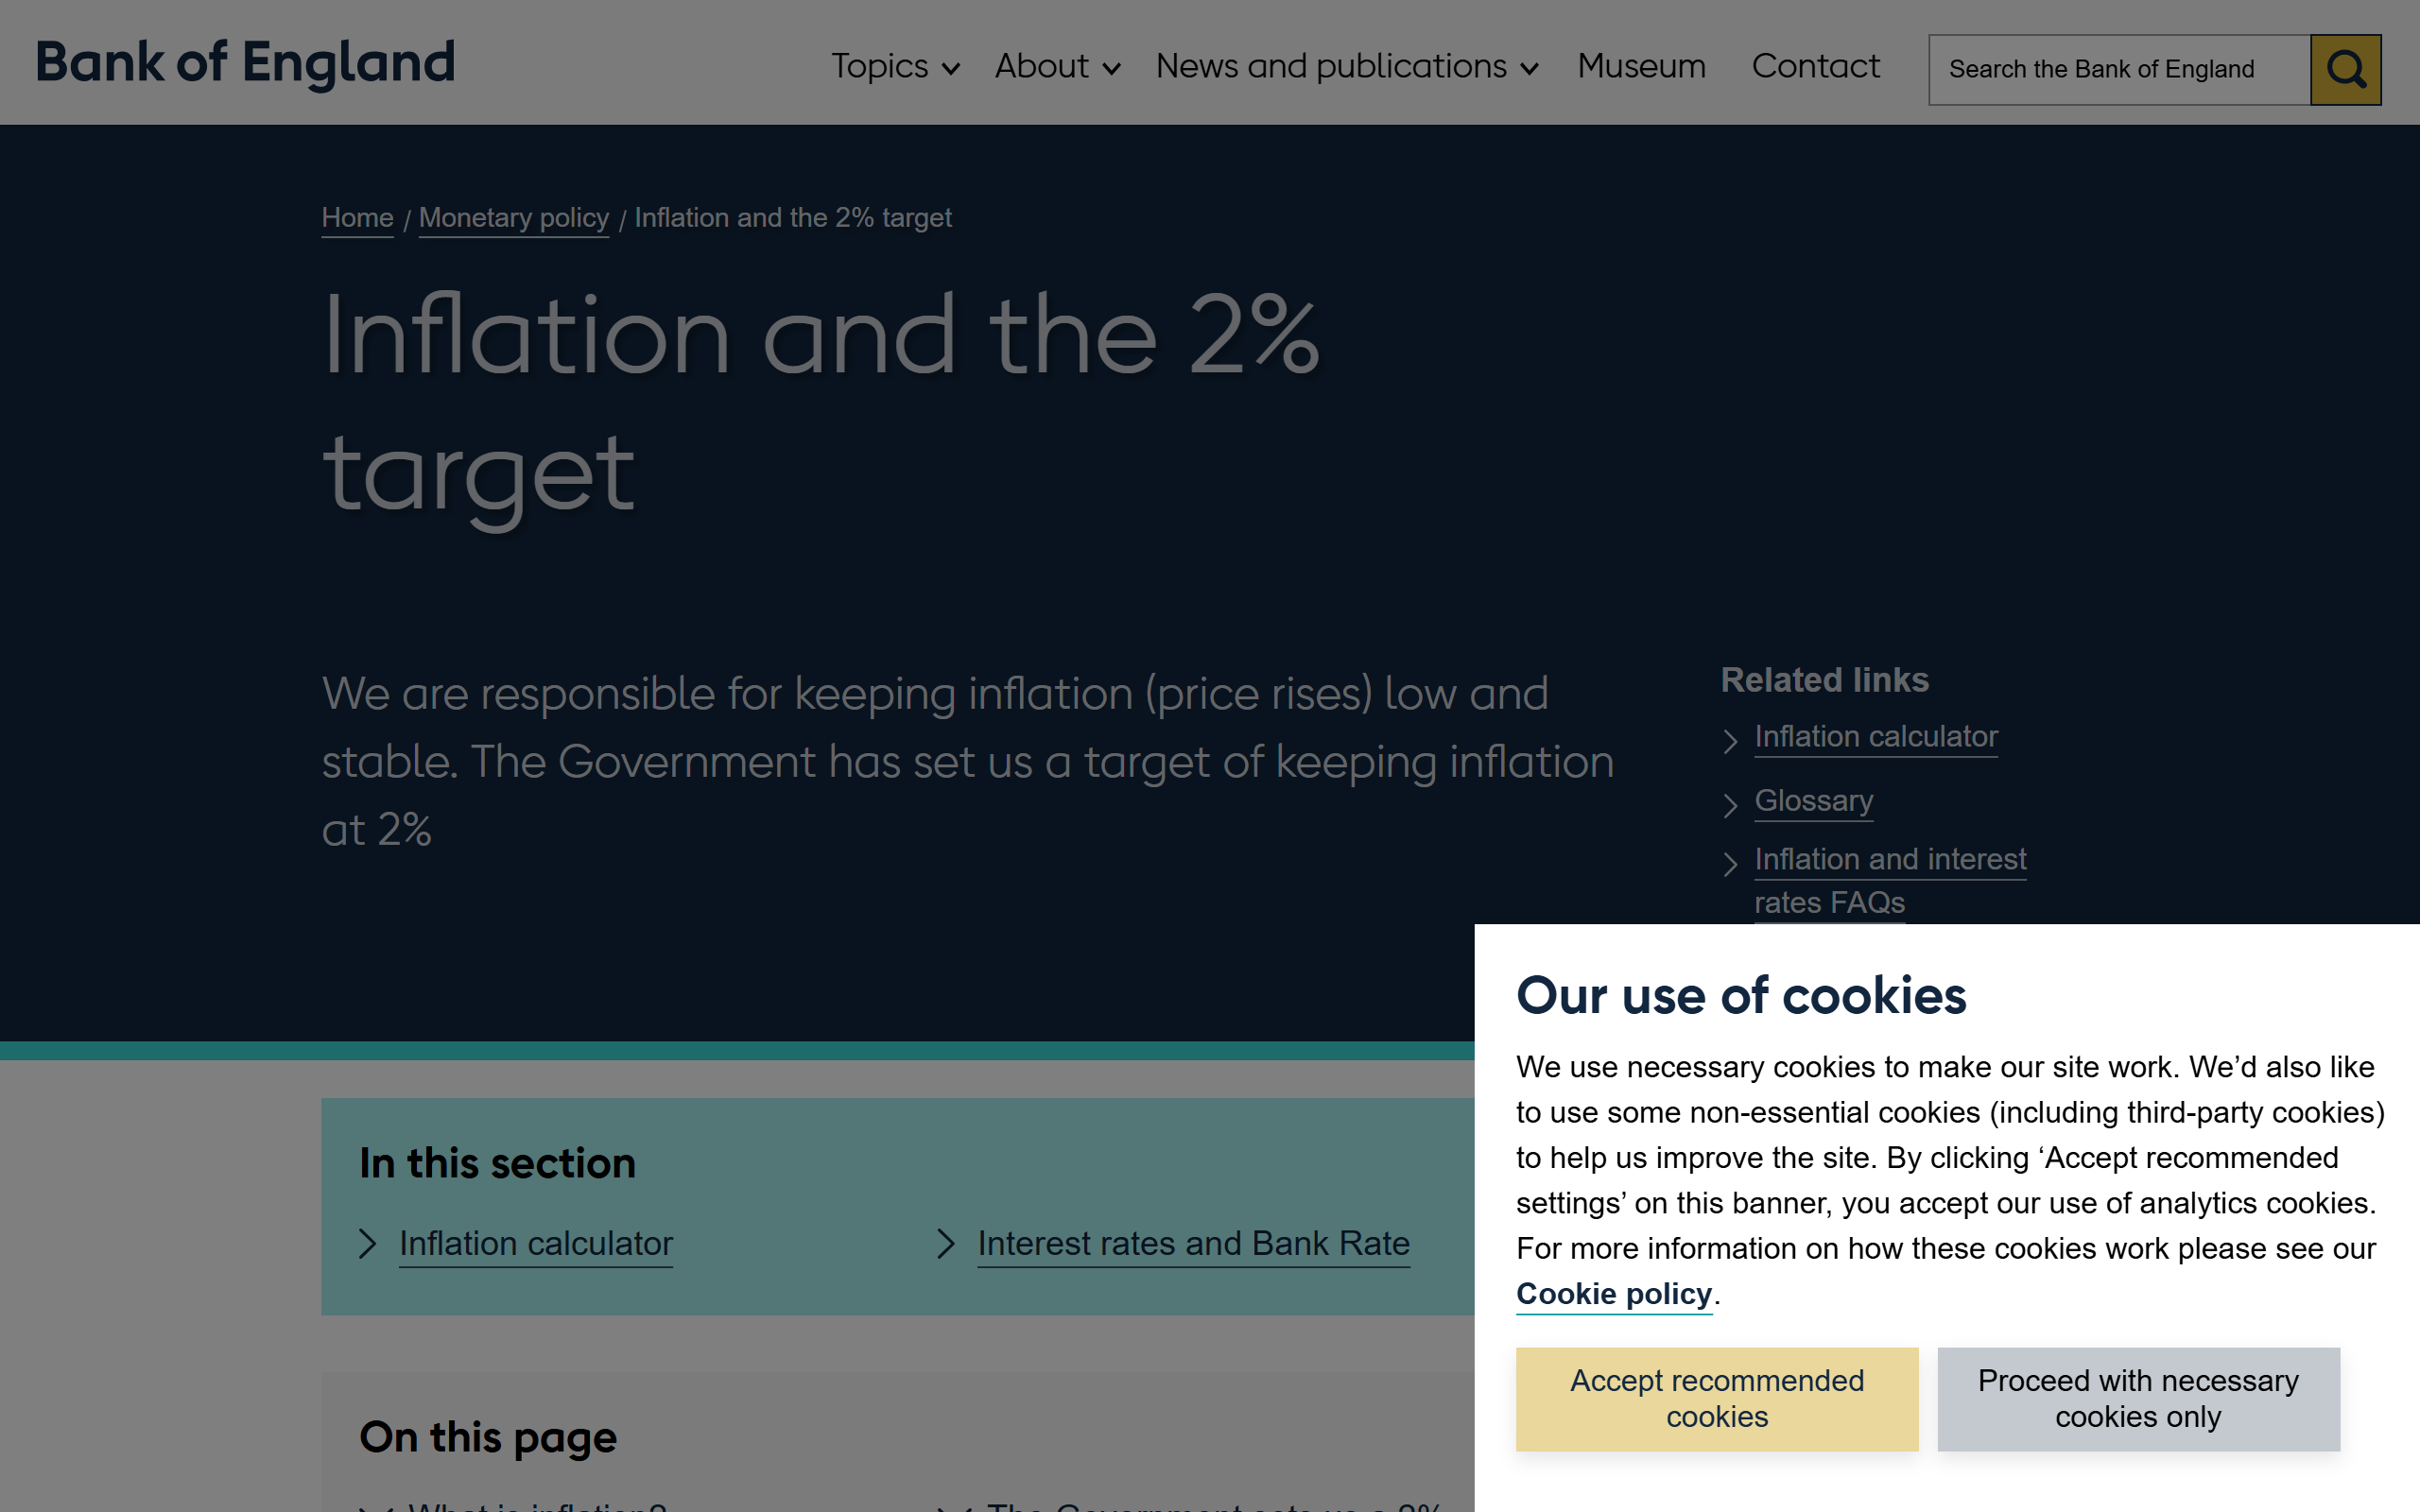
The long-run average annual total return of the S&P 500 is roughly 10% per year in nominal terms, around 7% once you strip out long-run inflation. That figure has held up across 90+ years of data, through the Great Depression, two world wars, the dot-com crash, 2008, COVID, and the inflation shock of 2022. It is not a promise. Individual decades have ranged from around 1% per year to over 17% per year. But it is the closest thing to a fair yardstick that exists.
When you ask "is my investment plan working?", the honest comparison is:
- Beating the S&P 500 over 5+ years: you are doing well, statistically rare.
- Within 1-2% of the S&P 500: you are doing fine, especially if you are taking less risk than 100% US equities.
- More than 2-3% below the S&P 500 every year: something is probably off.
Two important caveats. First, you should compare on a total return basis, including reinvested dividends. The Vanguard S&P 500 UCITS ETF (ticker VUSA on the LSE) is a clean way for UK investors to track this. Second, the S&P 500 is 100% US equities. If your portfolio includes bonds, gold, cash, UK or emerging markets, you would expect to underperform a pure S&P 500 in good years and outperform in bad ones. The fair comparison is "did my mix beat what I would have got from a simple global index fund," but the S&P 500 is the cultural benchmark and is fine as a sanity check.
For context, a globally diversified all-world tracker like Vanguard's FTSE All-World (VWRL) has returned somewhere around 8-9% per year over the past two decades. That is lower than the S&P 500 because the rest of the world has dragged it down, but it is also lower-risk by virtue of being more diversified. Most UK investors are better served by a global tracker than a pure S&P 500 fund, even if the S&P number looks shinier in the rear view mirror.
Why One Year of Data Tells You Almost Nothing
If your investment plan returned 22% this year, congratulations, that is a great year. It also tells you almost nothing about your plan.
Stock market returns are extremely lumpy. The "average 10% per year" of the S&P 500 hides years of negative 30% and years of positive 35%. The actual annual return falls between 8% and 12% in only about a quarter of historical years. Most years are either much better or much worse than the average. The average only emerges when you stack enough years on top of each other.
This matters because if you judge your plan after 12 months, you will probably draw the wrong conclusion:
- A bad year does not mean your plan is broken. 2022 saw global equities fall around 18%. Anyone who panicked and sold locked in those losses just before a strong recovery.
- A good year does not mean you are a genius. A 25% year often just means you happened to be holding the right index in a strong market. Beware the temptation to take credit for what was really a tide rising under all boats.
You need at least three to five years of data, and ideally ten or more, before you can fairly judge a plan. Anything shorter and you are mostly measuring noise. The short windows are worth tracking only to make sure you are not doing anything catastrophic, like sitting in cash by accident or running 80% in one stock.
A useful habit: review your plan once a year, on the same date, and write down both your total return and the S&P 500 total return for the same period. After three or four annual entries, you will start to see a pattern that no single year could give you. Before that, the data is too thin to be honest about.
What to Do if You Are Underperforming
If you have done the maths honestly and you are clearly trailing the index by 2-3% or more per year, over five-plus years, on a like-for-like basis, the most likely culprits are:
- Fees. A 1.5% annual fund charge does not sound like much, but compound it over 30 years and it can eat a third of your final pot. Check the ongoing charges figure (OCF) on every fund you hold. Anything over 0.3% for a passive fund or 0.75% for a platform fee deserves a second look. Our piece on low-cost index funds lists what cheap actually looks like in 2026.
- Stock picking. If you are choosing individual companies, the data is brutal: most active investors, including the professionals, fail to beat the index. The full evidence on this is in winning the losers' game. There is no shame in admitting it and switching to a global tracker.
- Cash drag. Money sitting in your investment account uninvested earns nothing useful and silently drags your return down.
- Currency mismatch. A UK investor holding US shares directly is exposed to GBP/USD moves. Sometimes that helps, sometimes it hurts. Currency-hedged funds remove that variable but cost a little more.
If two or three of those apply, the simplest fix is the one most professionals quietly use for their own money: pick a single global index ETF, set up a monthly direct debit, and stop looking. That alone tends to beat the majority of more complicated approaches.
Frequently Asked Questions
What is a good annual return on investments in the UK?
For an equity-heavy portfolio held for the long run, a reasonable expectation is around 7-10% per year in nominal terms, or roughly 5-7% after inflation. Lower if you hold a meaningful share of bonds. The 10% figure most often quoted is the long-run average of the S&P 500 with dividends reinvested, and your own portfolio should be judged against a benchmark that matches what you actually own.
How long should I wait before judging my investment plan?
A minimum of three to five years, and ideally longer. Single-year returns are dominated by market mood swings rather than the quality of your plan. Reviewing annually is fine, but only act on patterns that show up over multi-year periods.
Should I compare my returns to the FTSE 100 or the S&P 500?
The S&P 500 is the more useful global benchmark because it is what most professional investors are measured against, and because it represents the world's largest and most influential companies. The FTSE 100 has lagged badly over the past two decades. If you hold a globally diversified fund, comparing to a global all-world index like FTSE All-World is the most honest like-for-like check.
Are dividends really included in the S&P 500's 10% return figure?
Yes. The 10% long-run average is the total return, with dividends reinvested. The price-only return of the S&P 500 is closer to 7-8% per year. This is why total return is the only fair basis for comparison: ignoring dividends understates the index by around 2 percentage points per year, which compounds into a huge gap over decades.
What if my portfolio is beating the S&P 500?
First, verify on a total return basis over at least five years, not a single lucky year. Second, check whether you are taking on substantially more risk to get there, single-stock concentration, leverage, or sector bets. Beating the index over a long stretch is genuinely rare and often comes with risk you have not fully priced in. If it holds up, fair enough, but be honest with yourself about what is driving it.
Further Reading:
The Little Book of Common Sense Investing - John Bogle - The case for using a low-cost index fund as your benchmark, written by the man who invented the index fund. The single most useful book on why most investors should stop trying to beat the market and just own it. (Affiliate link - we may earn a small commission at no extra cost to you.)
The Behavior Gap - Carl Richards - Why most investors underperform the funds they hold, and how to stop sabotaging your own returns when reviewing performance. (Affiliate link - we may earn a small commission at no extra cost to you.)
Enjoying the content?
If this site has been useful, a coffee goes a long way.
Browse more articles
Browse all